
Be on the lookout for ascending triangles in the coming weeks as the market works out what direction it wants to trend next. That is particularly true for stocks that are forming higher lows. Triangles are just holding patterns on route to a bullish or bearish move. Frequently, they are establishing a pattern to continue the previous trend, but iif they are forming a sequence of lower highs and higher lows, they are neutral. No matter if they're directional or non-directional, triangles are an indication that something big may about to happen.
Ascending Triangle Basics
In this case, ascending triangles are considered a bullish continuation pattern. That means that they intend to continue the previous bullish trend and is confirmed by a breakout to the upside. For some stocks that have seen more significant rallies off of the September 20 low, this pattern may be setting up.
For statistical inferences on these patterns, I’ve relied on the work done by Thomas Bulkowski.
Pattern Rating: 2 Star
Directional Bias: Bullish
Pattern Type: Continuation
Pattern Description:
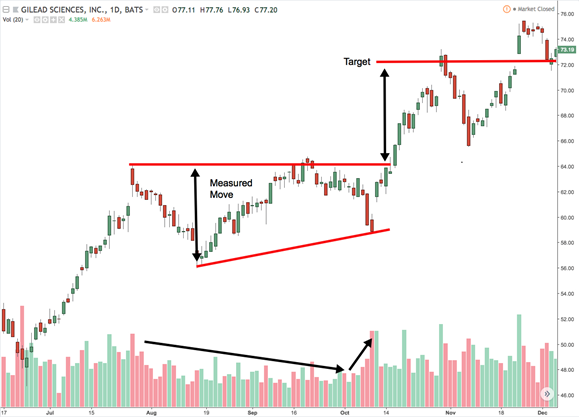
Ascending Triangle patterns occur within an uptrend and consists of equal highs and rising lows forming a triangle. This pattern should breakout within two-thirds to three-quarters of the way to the apex of the triangle.
Volume Description:
The volume declines throughout the triangle formation and should expand on the breakout.
Breakout Confirmation:
The confirmation for Ascending Triangle patterns is a close above the recent highs on above average volume.
Measuring Technique:
To calculate the expected moves, subtract the height of the first high and lowest low of the pattern. Then, you arrive at the target by adding the measured move to the breakout level.
Statistical Notes:
Ascending triangles perform better when volume is rising on the breakout. Throwbacks generally hurt performance.
Conclusion
Ascending triangle patterns occur relatively frequently and can be effective at indicating direction and measuring the expected move. Breakouts will often retest the breakout level, which can be frustrating for traders that haven’t prepared for that likelihood. However, identifying these patterns can be helpful at counting where you are in a trend and gauging the reward/risk or a trade.
Wondering when to hedge? See how unlocking the Vomma Zone can help you better understand when volatility is about to rise.
Want learn more about how to work with me? Check out Trader by Your Side!
Not a subscriber? Become a TheoTrade member
1 Comment
Michael Phipps
October 14, 2021So what would be good is a list of stocks with these characteristics. YOu might have talked about this on Thursday. I'll check.