
The first hurdle in the debt ceiling saga is the September 30 deadline for funding Federal agencies or face a partial government shutdown. This would mark the second partial shutdown in the last three years. While the threat of an outright default is likely a non-issue, it is interesting to see how traders are positioning ahead of these events.
Debt Ceiling Default Indicator
The first point is that there would be Treasury bond selling in the case of an imminent default. I always like to ask where the selling would occur. Most people will typically respond that the longer-dated bonds should get hit. Meaning that the 30-year would sell-off more than shorter-term bonds like 3-month T-bills.
The reality is that debt with the shortest maturities will experience the most selling. In the end, this makes the most intuitive sense since a 3-month T-bill will need to be repaid long before a 30-year Treasury Bond. The chart below is an example of the rise in 3-month Treasury yields before the 2011 debt downgrade.
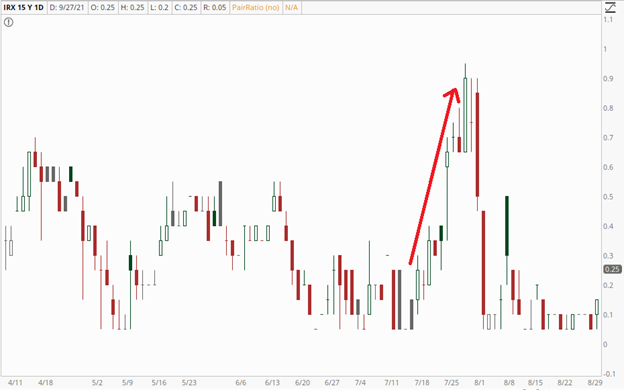
That sell-off wasn’t all that dramatic, but it’s an indication of what generally happens. The issue was that a default was never an issue and isn’t now. What is at issue is the longer-term sustainability of our debt and potential for a future default.
UOA Debt Ceiling Setup
As we’re approaching some key dates surrounding the debt ceiling, it’s interesting to see how traders are positioning themselves this week. The first is the products that are being traded, then there’s the direction and magnitude of the potential movement.
The first thing is that bonds have been week and there was a fair amount of bearish activity last week in TLT. Looking at the activity below, you’ll notice that it will help banks, pressure junk bonds, and hurt the dollar. The weaker dollar also helps emerging market currencies and potentially their stocks. This is exactly what’s happening today. Here is a breakdown of the significant activity:
- Invesco DB US Dollar Index Bullish Fund (NYSEARCA: UUP)
- 13,000 1 OCT 21 $25 puts mostly BOT @ $0.04 to $0.05
- iShares iBoxx $ High Yield Corporate Bond ETF (NYSEARCA: HYG)
- 15,000 5 NOV 21 $86 puts mostly BOT in 1 print @ $0.32
- 20,000 5 NOV 21 $82 puts sold in 1 print @ $0.08
- iShares MSCI Emerging Markets ETF (NYSEARCA: EEM)
- 44,000 19 NOV 21 $53 calls BOT in 1 print @ $0.69
- JPMorgan Chase & Co. (NYSE: JPM)
- 13,000 1 OCT 21 $167.50 calls mostly BOT @ $0.47 to $1.56
- Bank of America Corp (NYSE: BAC)
- 18,000 1 OCT 21 $43 calls mostly BOT @ $0.21 to $0.74
The above activity reflects a bullish expectation for EEM and banks, but a bearish outlook for HYG and UUP.
Conclusion
The debt ceiling isn’t exactly going to be a major event historically. It’s just a significant mile marker on the path to our future ruin. Unfortunately, the gas gauge is broken and the amount of gas in the tank is unknown. However, it doesn’t mean that the next couple weeks can’t be accompanied by some excitement and volatility. These trades just give you some idea of where to look.
Wondering when to hedge? See how unlocking the Vomma Zone can help you better understand when volatility is about to rise.
Want learn more about how to work with me? Check out Trader by Your Side!
Not a subscriber? Become a TheoTrade member
1 Comment
ted Clevenger
September 27, 2021Good article, thank you.