What’s more ominous than dark clouds forming on the horizon. The temperature drops and the winds pick up as you sit back and await a torrential rain, hail or worse. If the skies turn green, you know that you better run for cover.
From a price standpoint, what is the equivalent of dark clouds on the horizon? That is where Japanese candlestick patterns come in. Their descriptive names provide a degree of emotional impact that to the observer and helps to represent the psychology of the pattern. In today’s post, you have a chance to learn about the candle pattern referred to as Dark Clod Cover.
Dark Cloud Cover Basics
The first things that the name implies is a change in weather conditions from good to bad. As a result, the blue skies of the price advance is changing with the introduction of selling. For every pattern, there is a setup and confirmation. Luckily, there has been a lot of statistical work done by authors like Thomas Bulkowski that have helped quantify the effectiveness of the pattern.
In the description below you’ll see a pattern description, frequency assessment, measuring techniques and a rating of the pattern.
Directional Bias: Bearish Reversal
Number of Candles: 2
Frequency Rating: 3 Star
Pattern Description:
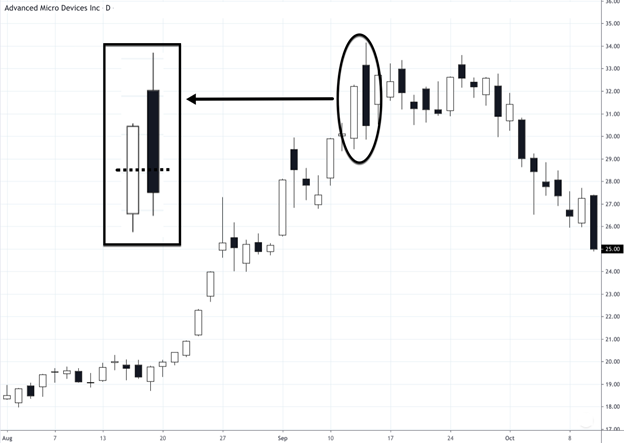
This pattern forms at the end of an uptrend. The formation begins with a tall open candle with the price gapping higher on the next candles open. The second candle is a closed real body with a close that finishes below the midpoint of the previous day’s body.
Volume Description:
Above average volume with increased volume as the price continues lower outperforms.
Statistical Notes:
Patterns where there is a large real body outperform smaller bodies. Formations with a neutral or down trending primary trend outperform.
Measuring Technique:
Measure the height of the formation from low to high over the two candles and subtract it from the closing price of the second candle.
Conclusion
This is just the first of many studies of varies price and candle patterns. Hopefully, the descriptions will help with your understanding of price action and market psychology. As far as patterns go, dark cloud cover can give you advanced warning of potential storms ahead. This can help identify areas to take profits or to enter a bearish trade.
Wondering when to hedge? See how unlocking the Vomma Zone can help you better understand when volatility is about to rise.
Want learn more about how to work with me? Check out Trader by Your Side!
Not a subscriber? Become a TheoTrade member