Cannabis Unusual Option Activity Report
After getting the post-election boost from the pro-cannabis bills passing, the momentum began to lag. As the price is currently flagging, the options market appears to be finding renewed optimism in the near-term prospects of the industry. You could say that these traders have, once again, found their “stash.”

The two companies in this industry that have been the most popular targets for option traders is Canopy Growth Corp (NASDAQ: CGC) and Tilray Inc (NASDAQ: TLRY). Over the past couple months, there have been two other times that this type activity popped up, and that was on October 5 and November 6. Both of those occurrences I wrote about for the blog.
If you missed some of my previous posts on the industry, feel free to check out my other posts here and here.
Cannabis Option Activity
For both of these cannabis stocks, the expiration was for this week. Normally, I would like to see a little more time, but that may materialize in the coming days. This is the earliest indication of a potential near-term bullish move. Here is a breakdown of the cannabis option activity:
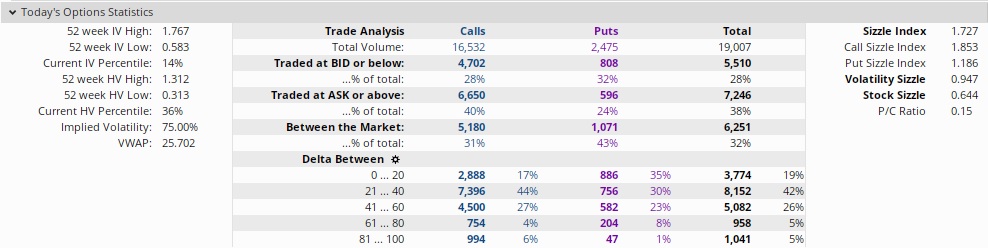
- CGC—2,300 18 DEC 20 $27 calls mostly BOT @ $0.21 to $0.39
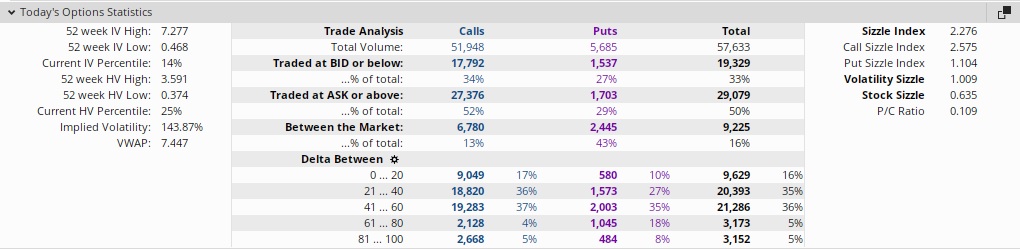
- TLRY—8,500 18 DEC 20 $7.50 calls mostly BOT @ $0.20 to $0.41
The option activity on CGC is about 1.7 times the average with call option volume over 1.8 times the average. The put-to-call ratio is at 0.153. This is significant call option volume with 40% of the volume getting filled at the ask.
The option activity on TLRY is over 2.3 times the average with call option volume nearly 2.6 times the average. The put-to-call ratio is at 0.109, with over half of the call option activity getting filled at the ask.
Cannabis Technicals
Let’s take a closer look at the charts of these cannabis stocks and the near-term potential.
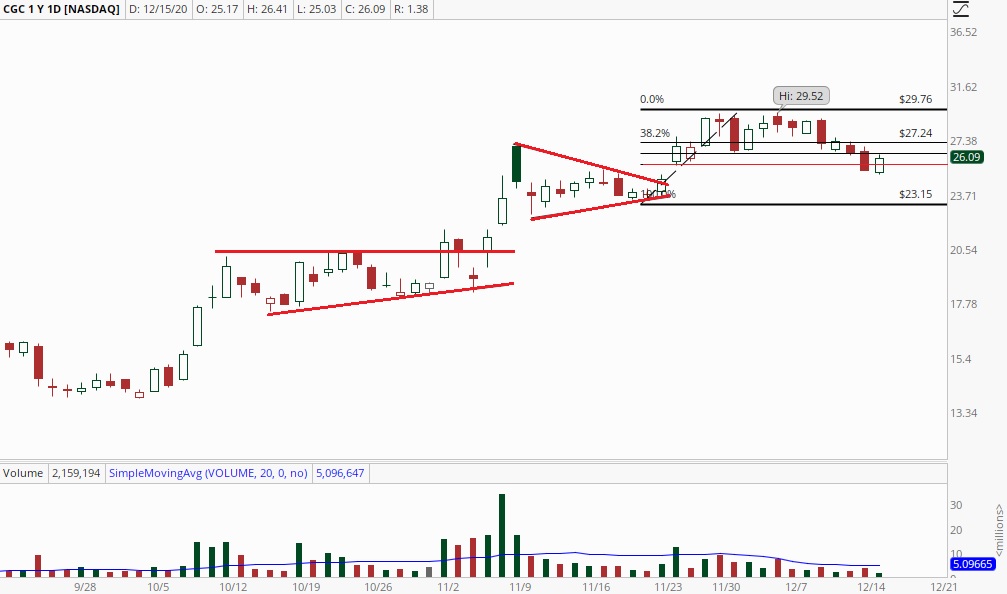
CGC Chart
The price of CGC has recently begun pulling back after a nice run off of the October low. The price formed an ascending triangle in mid-October and then a pennant formation in early November. When the price plateaued near $29.50, it broke it’s trendline with it began to retrace this past week. Today, the price is testing the 61.8% retracement of the late-November move and is forming a piercing line. This is a bullish candle formation. The near-term potential is a retest of the high near $29.50 and longer-term potential to $53.
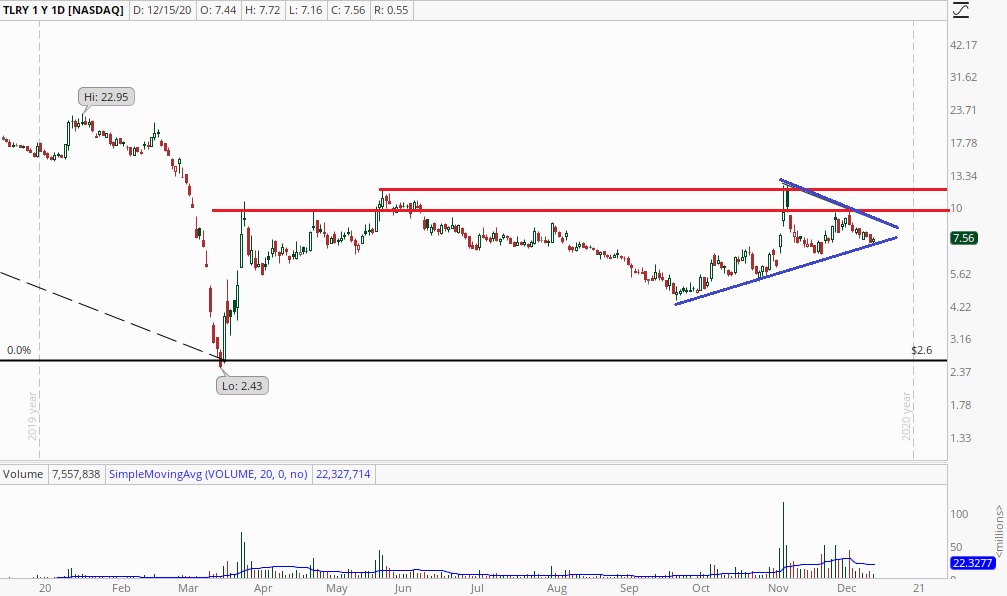
TLRY Chart
TLRY is currently testing its rising trendline from the September low near $4.41. Following the spike higher on November 6, the price fell back quickly to support and made a smaller rally in late November. As the price failed near previous resistance at $10, the price fell back and is currently testing the rising support level. The price is currently setting up with a bullish harami candle pattern and has a near-term target of $10.
Conclusion
Since the March low, this type of option activity on the cannabis industry has been a consistent indication of potential bullish movement. The one detracting factor is that it’s for this week’s expiration and the strikes are either ITM or close to the money. However, the prices are setting up near projected support levels and that expectations in the near-term is to retest recent highs. Given the bigger theme of supportive initiatives that passed, it is encouraging for these stock testing even higher price in the coming months.
Learn how to deal with uncertain markets by learning about the Vomma Zone. Not a subscriber? Become a TheoTrade member.
1 Comment
Charbel EL-Kassis
December 16, 2020Hi there,
I am a member of Theo trade, i would like to know if you have a ONE ON ONE option Trading program? If you do, how many hours and how much is the price.
Please let me know as soon as you get this message