Post-Election SKEW
One of the indices that I follow closely is the Cboe SKEW Index (SKEW). For those that actively trade options, the concept of skew is probably not a foreign concept. However, most people aren’t aware that there’s an index that tracks the level of skew for the S&P 500 Index options. Looking at the level of skew pre-and post-election gives some good insights into how large traders are hedging themselves. Currently, it’s telling investors to proceed with caution. Here’s why.

Implied Volatility and Skew
Before you can really come to appreciate the SKEW index, it’s important to understand some implied volatility basics.
Implied Volatility
Implied volatility is a measure derived from option prices that factors in the future expected movement of the stock. One of the issues with looking at implied volatility (IV) is that it is calculated for each strike price of each expiration and they’re all different!
Because of this, it is common to take an average. This is what the VIX does. It takes a 30-day weighted average of implied volatilities of the expirations just before and just after 30 days. The average implied volatility for each expiration uses the OTM call and put options.
Skew
Averages are great to use but is there any value to looking at the individual implied volatility of each strike price? In a word, yes!
The difference in implied volatility between each strike price tells us something about the shape of the distribution of S&P 500 or individual stock returns. This understanding is important and central to the concept of volatility skew.
A good way to understand this is to ask a question. If I told you that the S&P 500 was going to move 10% tomorrow, which direction would you guess it would go? Up or down?
If you’re acquainted with market history, you would have to say down. However, this wasn’t universally accepted in 1987, just before the crash on Black Monday. At that time, a graph of implied volatility for an expiration was represented by a smile. That means, the lowest IV is ATM and increases equally as you move to higher and lower strike prices. At the time, it was referred to as a “volatility smile.”
Following that event, the shape of the volatility smile changed. The image below is taken from the CBOE white paper on the SKEW Index and shows the change in the IV curve.
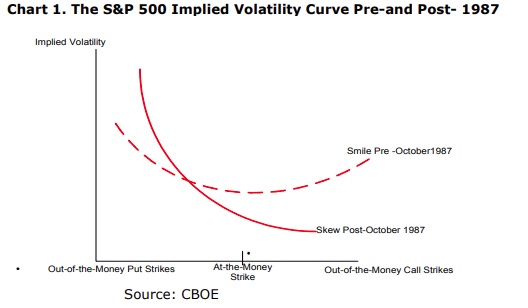
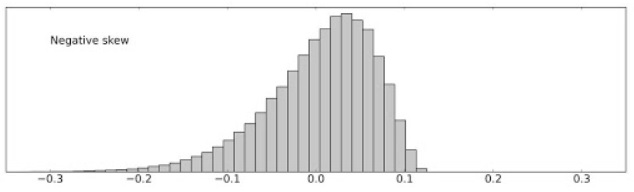
As you’ll see in the chart, the smile turned into a smirk. This shows that the market is reflecting a skewed lognormal distribution of S&P 500 returns. The long tail of the negative distribution represents the concept of "tail risk." The image below is an example of this type of skew and the long tail risk to the downside.
Skew Meaning
The change in the IV curve across strike prices reflects a skewed distribution of S&P 500 returns. Back to my question about the 10% move in the SPX. Since the market now realizes that the market crashes downward, the put implied volatilities need to be higher than the call option implied volatilities. This the option market’s attempt at reflecting this understanding.
What is mechanically causing this is the puts being bid higher and the calls being sold. This type of collar trade of selling calls and buying puts creates the shape of the IV curve and volatility skew. Collars are an option hedging strategy for long investors.
What we can conclude about the existence of skew on major market indices is that it’s a result of large hedgers. A rising skew is representative of increased hedging activity and a falling skew is representative of diminishing hedging activity. Skew declines when puts are bought while the VIX is rising.
Reading the SKEW Index
The Cboe has taken the changing shape of the IV curve and created an index around it. If you’re looking at a chart of SKEW, there’s a couple of important things to understand:
- A value of 100 indicates there is no IV skew
- Greater than 100 indicates there is reverse or negative skew
- Below 100 indicates there is forward or positive skew
- Historically, the value doesn’t fall below 115 very often
- Historically, a value greater than 130 is high
Shortly after the sell-off in early September, the price fell back near 115. However, the price reversed higher leading into the election. Collar-based hedges is what causes this to happen and is the result of perceived tail risk.
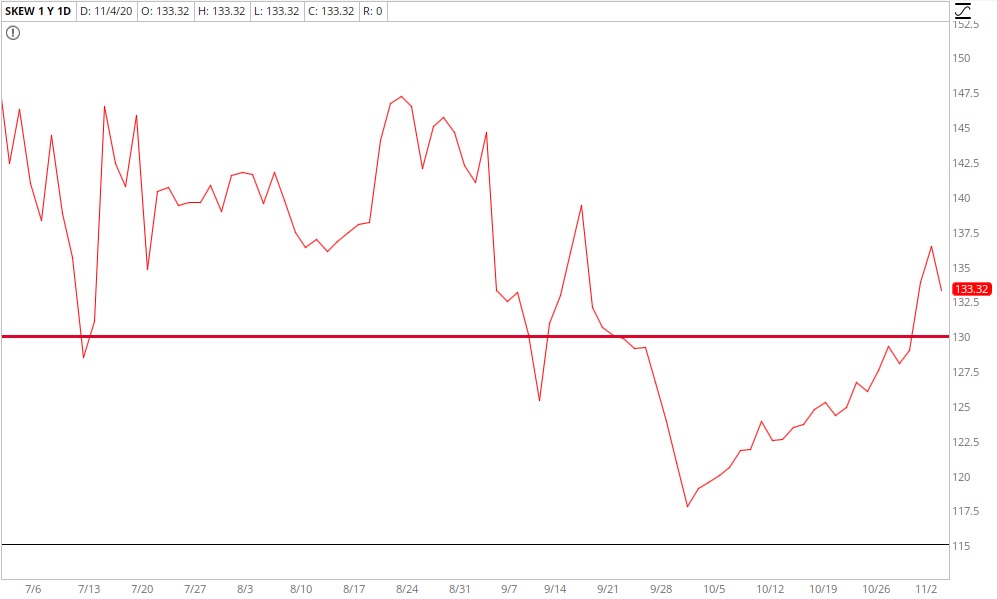
You’ll notice that the price rose above 130 just before Tuesday’s election results. This represented the trepidation leading into the election. What’s also an important note is that as the VIX dropped yesterday, the SKEW level has remained the same and is above 130.
Conclusion
The fact we don’t have a U.S. president elect in the most important nation in the world is reflected by the SKEW remaining high. With SKEW at this level, it’s an indication that we’re not out of the woods yet and large investors are still concerned about significant downside risk. That means, if you’re hedging, you may want to hold them a little longer. It also means, if you ‘re not hedged, you may still want to consider it. A return to normalcy would be the SKEW index falling back toward 115 to 120.
Learn how to deal with uncertain markets by learning about the Vomma Zone. Not a subscriber? Become a TheoTrade member.