Spending By City
Consumer spending isn’t correlated with the cities with the largest COVID-19 outbreaks. It’s more about the economic restrictions. That's not saying the economy would be fine without the restrictions. It's just looking at the data in the table below and comparing it to the spike in cases in the fall.
For example, Illinois has seen a spike in cases, but Chicago had 6% card spending growth which is more than most of the cities listed. Michigan also has had a spike in cases, yet Detroit had the highest sales growth. Minneapolis is the only Midwestern city with lower than average growth.
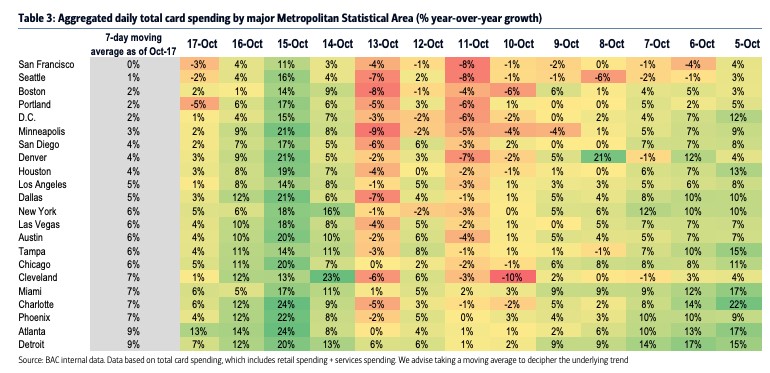
Cities with the worst growth haven’t seen spikes in cases recently. In fact, Washington D.C.’s 7 day average death rate is 0, yet it had 2% card spending growth in the past 7 days. San Francisco is in the worst shape as it had no growth. That makes sense because California’s unemployment rate is 11% which is the 2nd highest in the country. New York and Las Vegas had 6% growth which is surprising because their states have unemployment rates of 9.7% and 12.6%.
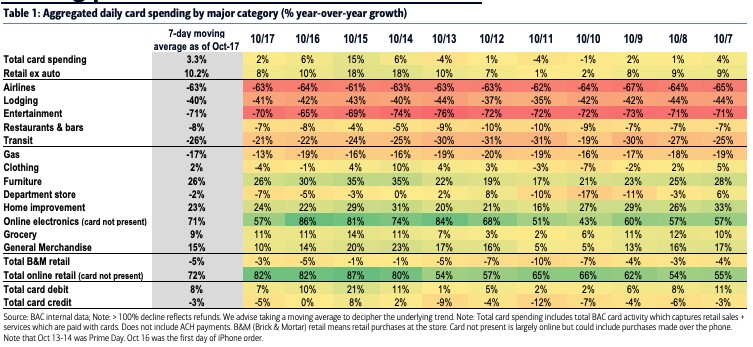
Entertainment Still Crushed By COVID-19
Now let’s look at the spending in each industry. This is as of October 17th which means it’s more updated than the very strong September retail sales report. It's surprising that airline spending growth didn’t improve since airline traffic has been increasing in the past few weeks.
Spending was down 63%. Spending on entertainment and lodging was down 70% and 41%. A recovery in entertainment has been almost non-existent. Best thing you can point to is a few sparsely populated sporting events in the MLB and NFL.
NHL wants to have fans in attendance when its season starts early next year, but that might also end up being at limited capacity. There is no set time for when the season starts/ends, but it’s entirely possible we can see games at full capacity by the end of it.
The Super Bowl can be used as an unofficial way to gauge how the country is fighting this virus. It is on February 7th. Let’s see how many fans are able to go to that game. If the vaccine is partially distributed by then and testing further ramps up, it could be a symbolic point which indicates the country is largely over this terrible virus.
On Friday the U.S. government allowed AstraZeneca and Johnson & Johnson to resume their phase 3 vaccine trials. AstraZeneca had been on hold since early September and Johnson & Johnson was on hold since October 12th. Deputy Chief of Staff of the U.S. Health Department stated he thinks a vaccine for the most vulnerable patients will be out by the end of the year. Then all seniors will have access by the end of January, in time for the Super Bowl. Finally, by April everyone should have access to one.
Spending on home improvement was up a massive 23%. This is not sustainable. People can only spend so much on their homes. When they leave the house more, they will spend less on improvements. That’s the same for furniture spending which is up 26%.
One other point on furniture is people bought office furniture to work from home. Online electronics is much in the same as the 71% growth rate won’t continue. At least with electronics, the products need to be repurchased after a few years. Someone can keep a piece of furniture for decades if they want to.
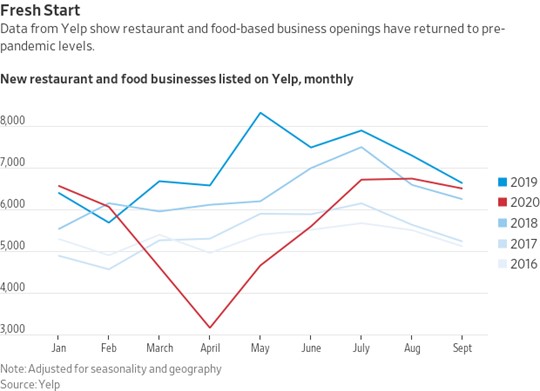
Restaurants Opening?
There has been a spike in new business openings in the past few months. That’s partially because there is increased demand for new products that weren’t popular prior to the COVID-19 economy. Think about how more people are spending time outdoors and away from the workplace. Plus, when companies die, new ones take their place as the market share is up for grabs. That’s an important point because it contextualizes the chart below.
As you can see, there are nearly as many new restaurant and food businesses listed on Yelp as 2019. That’s after new restaurants from April to July were way below last year. According to Yelp, North Dakota was the most resilient state for restaurants.
Let’s see how it holds up from the onslaught of cases in the past few weeks. This data is only as of September. New York was surprisingly the 11th most resilient state. The least resilient was South Dakota.
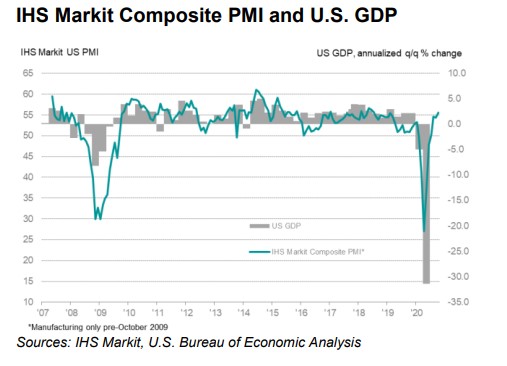
Markit Flash PMI Composite Improves
As you can see from the chart below, the October flash composite PMI was up solidly. It rose from 54.3 to 55.5 which is a 20 month high. This supports the recent rise in long bond yields. The service index was up from 54.6 to 56 which also is a 20 month.
Furthermore, the manufacturing PMI rose 1 tick to 53.3 which is a 21 month. “The US economy looks to have started the fourth quarter on a strong footing, with business activity growing at a rate not seen since early 2019.” It’s pretty impressive the economy was so resilient despite the spike in COVID-19 cases.
COVID-19 Gets Even Worse
A 3rd COVID-19 wave is here. Case counts are exacerbated by the spike in testing, but the virus is spreading in the Midwest. The chart below shows the positive rate in Oklahoma is up from the spring. Its hospitalization rate is at a record high. There were 4,378 new cases in Wisconsin which is the 2nd most ever. We could be near the peak in this state, but it’s unknown.
There were 83,010 new cases nationally which is a record. There were 1.28 million new tests. We just need that high testing to hold. It appears we are in the worst case scenario where more people are testing positive which spreads fear, but not enough tests are going out to actually stop the spread of the virus.
The only good news is shown in the bottom right chart. U.S. hospitalization rate spiked to a lower high in the summer. Let’s see if this spike has another lower high.