HOG Unusual Option Activity Report
It appears that there may be some trepidation for Harley-Davidson Inc (NYSE: HOG) investors headed into tomorrow’s earnings report. The price closed above recent resistance on Friday near $29.50 but finds itself 4.2% lower early Monday.
The company will announce their earnings Tuesday morning before the open. It appears that investors may be looking to take profits following its over 20% run since the September 25 low. Looking at Monday’s option activity, it appears that the option market is looking for downside to $26 this week. Let’s take a look at HOG and what analysts and the option market is saying.

HOG Recall
Last Thursday, Harley-Davidson announced the recall of 1,000 of their 2020 LiveWire electric motorcycles. While its estimated that less than 1% of the bikes had issues, the company is recalling the entire production run in order to update the software. This isn’t the first issue with the bike. The company had an issue with the onboard level 1 charger that allows owners to use a household electric outlet.
Analysts had estimated a first-year production run of 1,600 bikes, which makes the recall number significant. The current issues and the $30,000 price tag may cause potential buyers to hesitate, despite the largely positive reactions to the bike.
HOG Analyst Estimates
Analysts for HOG are currently estimating a 49.1% decline in current quarter earnings and a 94.8% decline in fiscal year 2020 earnings. Those year-over-year declines in EPS are significant, but likely priced in. At this point, it’s all about the guidance.
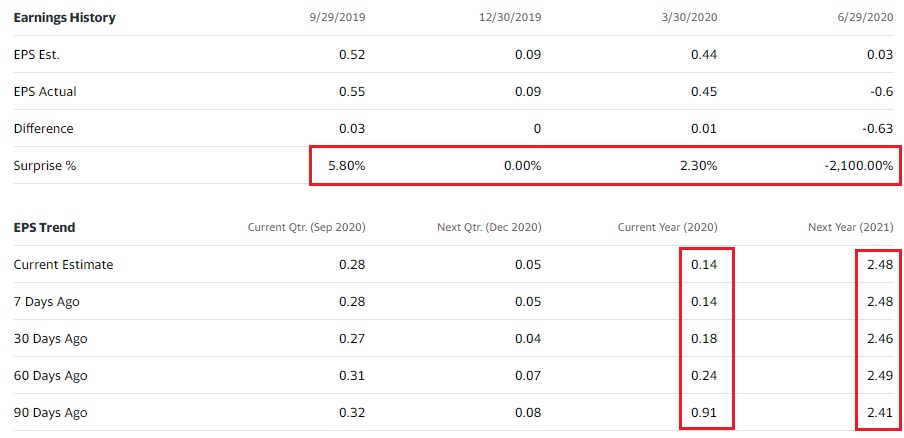
Following the last report, analyst cut their expectations dramatically. Earnings for fiscal year 2020 EPS got negatively revised from $0.91 to $0.24 following the report. That number was then changed further to its current estimate of $0.14 compared to $2.68 last year.
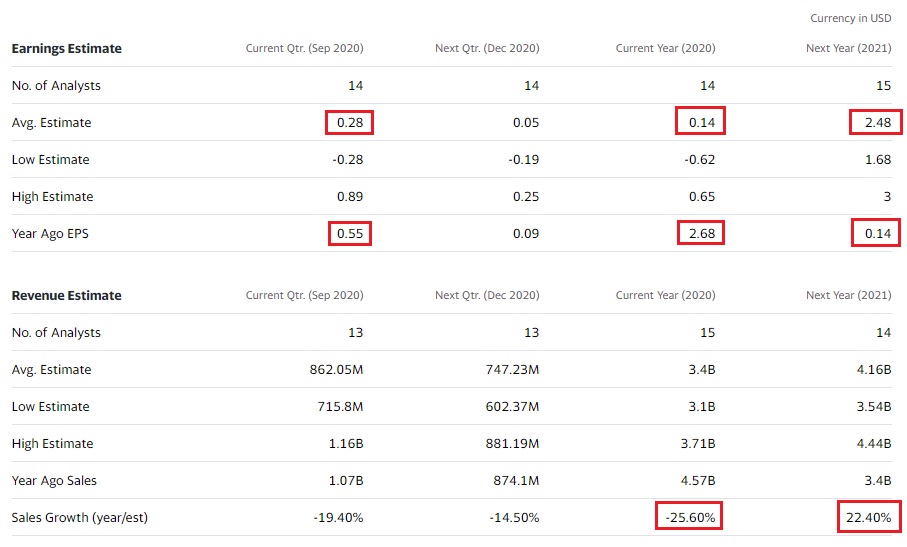
Looking forward to 2021, the estimates have actually been positively revised since the last report. The EPS for fiscal year 2021 was revised higher to $2.48 compared to $2.41. If the company causes analysts to lower it’s 22.4% revenue growth and $2.41 earnings in 2021, it could cause trouble for the share price of HOG.
HOG Option Activity
As of the time of this writing, the option activity was about five times the average for HOG. The volume on the call options is about three times the average. The put option volume is over eight times the average. For the puts, 57% of the volume was filled between the market and 40% was filled at the ask price. Most of the put option activity was filled in two prints. Here’s the details of those prints:
- 2,000 30 OCT 20 $29 put BOT @ $1.16 against open interest of 213
- 2,000 30 OCT 20 $26 put sold @ $0.18 to $0.19 against open interest of 65
The above trade is a long put vertical for this week's expiration. Essentially, it’s a play looking for the price of HOG to be at $26 or less by the end of the week. With a cost of $0.98 a share, that gives a maximum gain of $2.02. That is a 2:1 ratio of reward to risk.
HOG Expected Move
The trade represents that traders’ expectations for HOG over earnings, but what does the options market say generally? This is where using the expected move is helpful to gain that type of understanding.
The average implied volatility for the 30 Oct 20 expiration is 93.14%. That number represents a one standard deviation range for one year. Breaking that down to a discrete timeframe for this week yields an expected move of $2.50 for this week. That means that the market is pricing a +/- $2.50 move over the next four days, which encompasses the earnings announcement.
With the price currently at $29.00, that gives a one standard deviation range of $26.50 to $31.50. Taking this information and looking at the trade, it reflects bearish price expectation that is extending just beyond the expected move.
HOG Technical Analysis
Looking at the earnings price statistics for HOG over the past three years shows how the options pricing reflects on historical price movement. Here is a summary of the earnings moves:
- Gaps Up: 5
- Ave Gap Up: 4.8%
- Max Gap Up: 8.98%
- Gaps Down: 7
- Ave Gap Down: -4.95%
- Max Gap Down: -9.31%
You’ll see from the stats above that there is a slight bearish bias with more bearish than bullish gaps on earnings. The numbers also show that the price has resulted in a gap in every earnings report. The average gap is also similar with 4.8% average gap higher and 4.95% average gap lower.
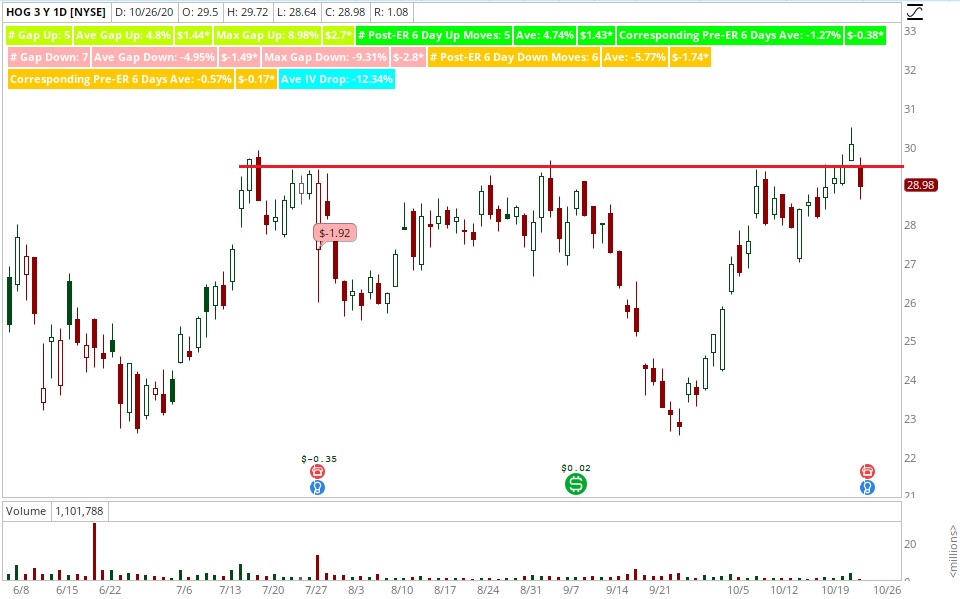
Looking at the 6-day average movement following the earnings report, here’s the data:
- Gap Up: 4.74% average 6-day move higher
- Gap Down: 5.77% average 6-day move lower
Conclusion
Statistically speaking, HOG has a slightly greater chance of a downward gap than an upward. The relative overbought nature of the stock price and the trepidation going into the earnings today should give bulls pause. As consider trading the earnings, this trade does give a decent setup to play the earnings.
Learn how to deal with uncertain markets by learning about the Vomma Zone. Not a subscriber? Become a TheoTrade member.