
S&P 500 Option Activity Rally Cap
I frequently watch unusual option activity and today saw an unusually large bullish trade made on the SPDR® S&P 500® ETF (NYSEARCA: SPY). Bullish? Yes, you heard it here first!
While the activity alone doesn’t lead to certainty, it is an example of the outlook by some large traders. Before we dig into the nitty gritty, let’s look at the details of the trade.

Unusual Option Activity
Looking at the activity at this point in the session, the SPY is experiencing above average option activity. The call option volume is 36% higher than average and the put option activity is over 20% above average.
Approximately 48% of the call option activity has filled at the ask price. Over 42% of the put option activity has filled at the bid price. While not overwhelmingly bullish, a general condition of buying calls and selling puts is bullish.
Let’s look at the actual trades.
- 22,400 20 NOV 20 $355 calls BOT in one print @ $5.00—above the open interest of 14,464
- 14,160 15 JAN 21 $380 calls sold in one print @ $6.40—above the open interest of 11,126
- 14,160 15 JAN 21 $365 calls BOT in one print @ $6.40—below the open interest of 25,212
- 21,240 18 JUN 21 $400 calls BOT in one print @ $4.13—above open interest of 19,170
- 7,080 18 JUN 21 $250 puts sold in one print @ $6.01—below open interest of 14,051
The SPY has traded over 700,00 contracts on both calls and puts so far today. That volume above is still significant because of the size of the trades and that it’s greater than the open interest.
Bullish…Really
Not convinced? Is there a bullish case to be made for the market?
I understand that we don’t have a stimulus bill and the Fed is sitting on their hands after the election. However, a bill will likely be passed before or shortly after the election and the Fed is standing ready to monetize.
While the centralized approach to engineering a bull market and the commensurate wealth-effect isn’t all-powerful, it’s likely not out of bullets…yet.
GDP Now
The Atlanta Fed publishes it’s GDPNow estimate for the U.S. economy. They are now projecting a 35.2% increase in Q3 GDP. After an abysmal Q2, that type of rebound isn’t only historic, but it makes back a large chunk of what was lost in Q2.
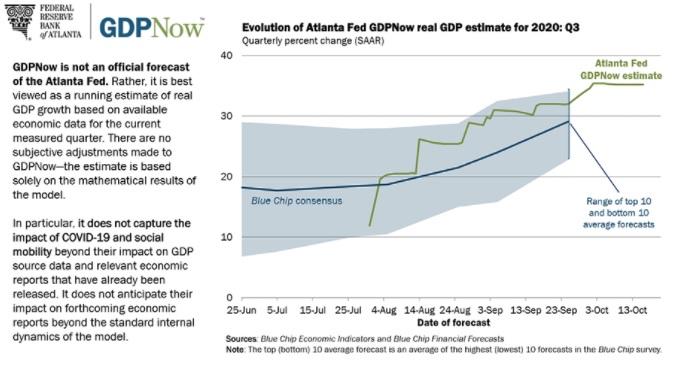
I understand that GDP isn’t exactly the best measure of real economic activity and that the U.S. posted a 4.2% Q2 GDP in 2008, but the market is considering it. The fact that a lot of the gains are coming from residential investment growth tells you that it can’t last forever.
Below the Surface of the S&P 500
One the biggest considerations for an end-of-year rally in the S&P 500 is the hedging that has already happened in the options market. For this, we’re going to take a look at a couple of charts for the Cboe VVIX Index (VVIX) and the Cboe SKEW Index (SKEW).
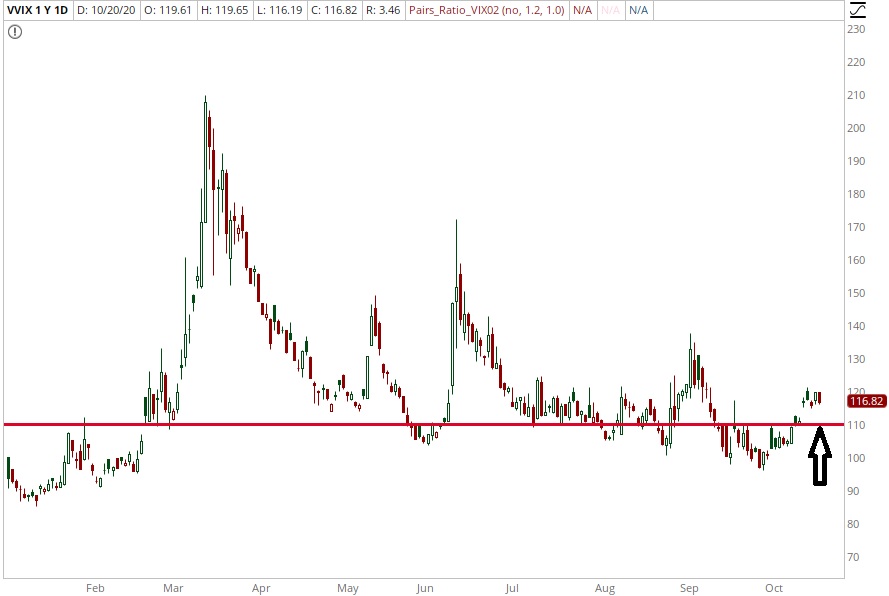
VVIX
VVIX is currently in the VommaZone! If you’re not familiar with the VommaZone, see how Don Kaufman has used it for over a decade to construct trades with massive upside potential. This zone occurs when the VVIX is above 110, which as you’ll see in the chart below is happening right now.
What this index tells us is the expectations for future movement in the VIX. The VVIX increases as institutional investors are hedging downside risk.
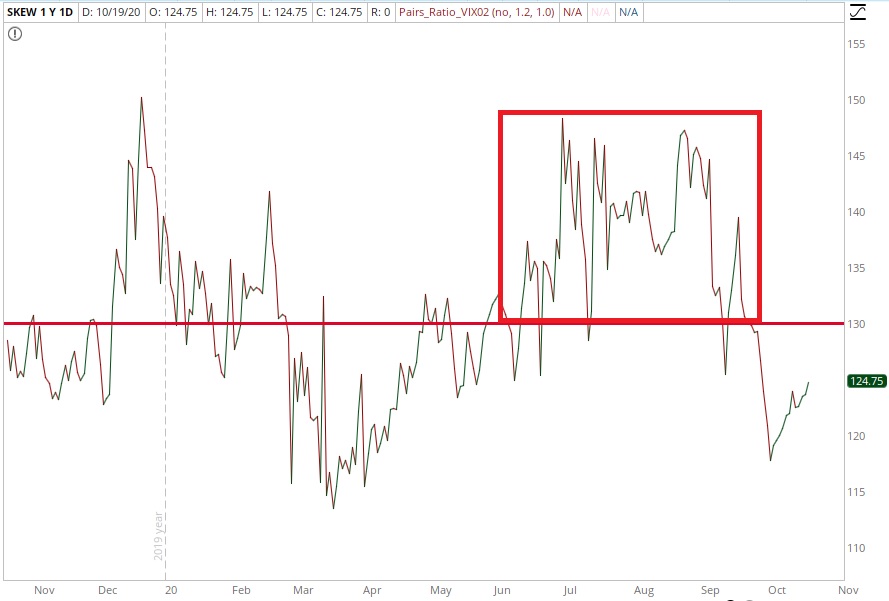
SKEW
SKEW Index is an indicator that measure the degree of implied volatility skew in the S&P 500 Index options. When the SKEW index is high, it’s an indication that there is a lot of call selling and put option buying. This condition is representative of the potential for tail risk or crash risk in the market. A value above 130 is considered high.
While the SEW Index isn’t currently above 130, it has been extremely high from June through the beginning of September. It wasn’t until we saw the small sell-off in September that the SKEW came down as hedgers prefer buying puts over a collar-type strategy. This is another indication that a lot of hedging activity has already taken place.
Conclusion
As you attempt to form a mosaic, it does begin to paint a bullish picture. The naysayers are right that the economy is on its heels but the timing for a more significant bear market may not be in the offing for 2020.
An anticipated stimulus from the Fed and U.S. government, the existent hedging that’s already been done and positive outlook for GDP makes the bull case increasingly more likely. Today’s unusual option activity is just a reflection of it.