3 Stock Market
Investors keep expecting this trend where a few stocks control the market to end, but it keeps going. This is one of the greatest bubbles in history, so we shouldn’t be surprised. Near the end of bubbles, we see the craziest action. That occurred on Monday as most stocks fell, but Tesla and Apple soared. It was their first trading day with their lower stock prices due to their splits. Tesla surpassed Visa’s market cap and Apple surpassed the entire market cap of all the Russell 2000 companies.
Third of the 3 was Amazon on Monday as it increased 1.5% to a new record high. Even the after hours session had euphoria as Zoom Video Communications rose 22.7%. It already had run up 40.17% since August 11th and 373.1% year to date. Apparently, that wasn’t enough! The firm reported 92 cents in EPS which beat estimates for 45 cents. It had $663.5 million in sales which beat estimates for $500.5 million which is 355% annualized growth.
Apple and Tesla were up 3.4% and 12.6%. The cloud index was up 0.7%; it was up 3.7% after hours because of Zoom’s report. Most stocks fell though as the S&P 500 was down 0.2% and the Russell 2000 fell 1%. Nasdaq was up 0.7%, but the advance decline line was -664.
VIX was up 3.45 to 26.4. That’s a massive 15% gain on a slightly down day for the S&P 500. This was the largest gain ever for the VIX on a day where the S&P 500 lost less than 0.25%. It was an awful day for small cap value as it fell 1.6%. Regional bank index was down 1.7%.
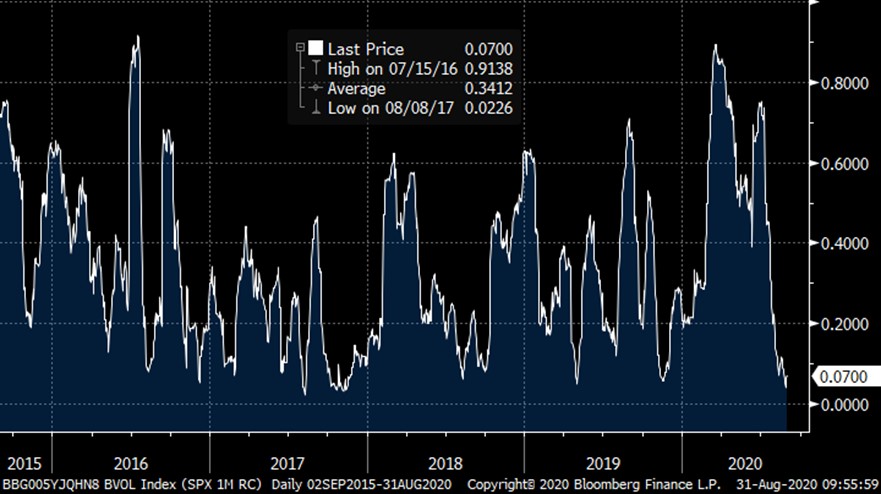
As you can see from the chart above, this is the exact opposite of the trough in March in which correlations were near 100%. Now correlations are near zero. Obviously, you don’t want to be the opposite of a bottom because that’s a top.
Tesla Bubble Is Like The Late 1990s Bubble
Tesla’s bubble is so magnificent that the bulls are literally calling for Tesla to make flying cars to justify its current valuation. Specifically, Tesla is said to be developing batteries that can power autonomous flying taxis that will fly over cities and cost the same as a regular cab fare.
It’s unlikely that electric cars dominate auto sales in the next few years even though the category will grow. And it’s highly unlikely self-driving cars become mainstream within the next 10 years. Flying cars that drive themselves are even less likely.
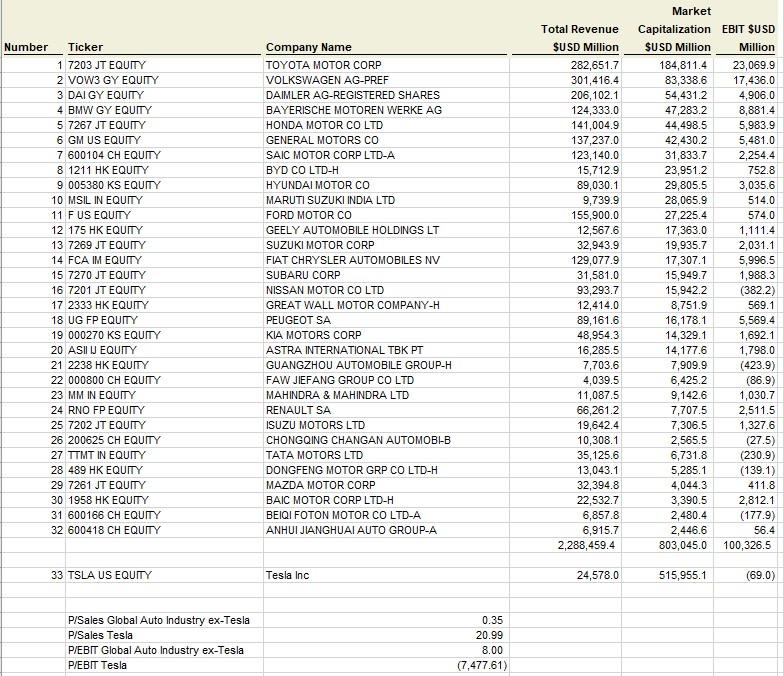
Comparing Tesla to other car companies is frowned upon by the bulls because they say Tesla is a tech company. However, comparing Tesla to other car companies is generous because Tesla isn’t making a profit on cars. As you can see from the table above, Tesla has a diluted market cap of $516 billion even though it only has $25 billion in sales and zero EBIT.
Rest of the auto industry is only worth $803 billion even though it has $2.3 trillion in sales and $100 billion in EBIT. Auto industry has 92 times the sales as Tesla, but only has about 1.6 times the market cap.
Apple Is The Biggest Bubble In Human History
Apple is the biggest bubble by market cap ever. Just calling Apple a bubble is a big deal because it’s so large. It's likely that Apple stock will fall over 70% in the next couple years. If the Russell 2000 fell 70%, it would be one of the greatest bear markets ever.
A lucky difference here is the small caps employ many more people than Apple. Secondly, if Apple fell 70%, it wouldn’t necessarily need to lay off that many people. It’s shareholders and index owners would lose money though obviously.
We shouldn't take bubble calls lightly. In fact, many weren't calling the FAANG stocks a bubble in 2018 or 2019. Several people still don’t think Facebook, Alphabet, and Microsoft are bubbles. However, they will likely fall at least 20% when the bubbles that are Netflix, Amazon, Apple, NVIDIA, and Tesla crash.
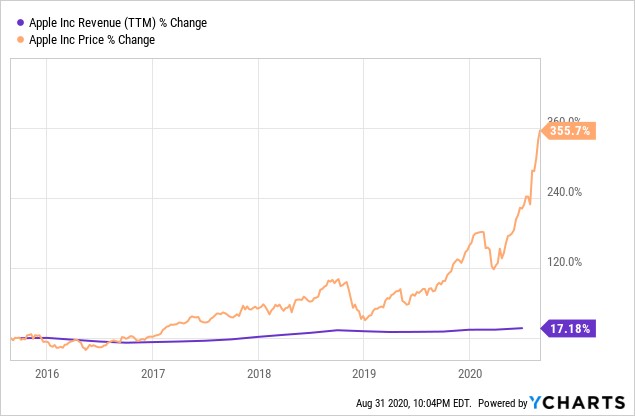
As you can see from the chart above, Apple’s stock price has increased 356% in the past 5 years even though its revenues are only up 17.2%. This bubble isn’t even exciting. Where is the growth?
Nasdaq Bubble
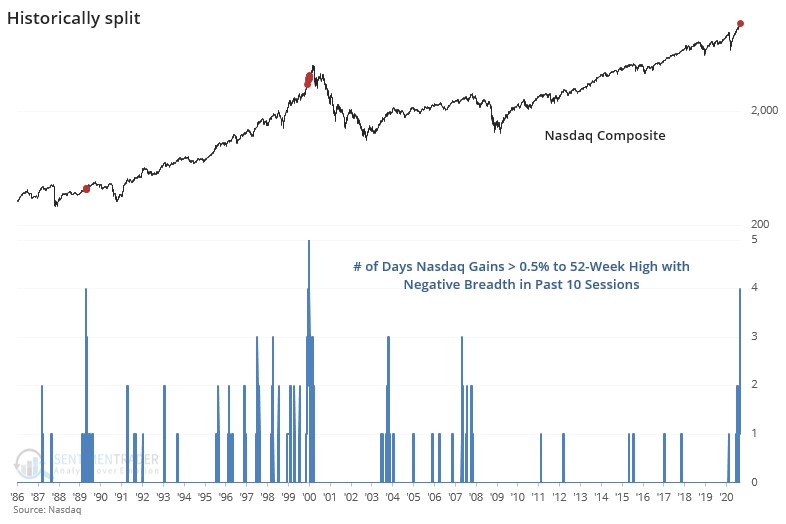
Nasdaq’s bubble is just like the 1990s. As you can see from the chart below, there have been 4 trading sessions in the past 10 where the Nasdaq has increased more than 0.5% to a new 52 week high with the index having negative breadth.
We need 1 more day to reach the reading in early 2000. You can argue we are no longer in the late 1990s. We have zoomed to early 2000 right before the peak. We have had 2 years of rallies (1998-2000) in 6 months.
Nasdaq 100 has increased 64.1% of the time this year. That’s the highest winning percentage at this point in the year since at least 1985. It’s pretty easy to have a rally like the one from 1998 to 2000 if the index rarely declines. Previous record was 63.5% in 1995. 1999 doesn’t come close to this winning year.
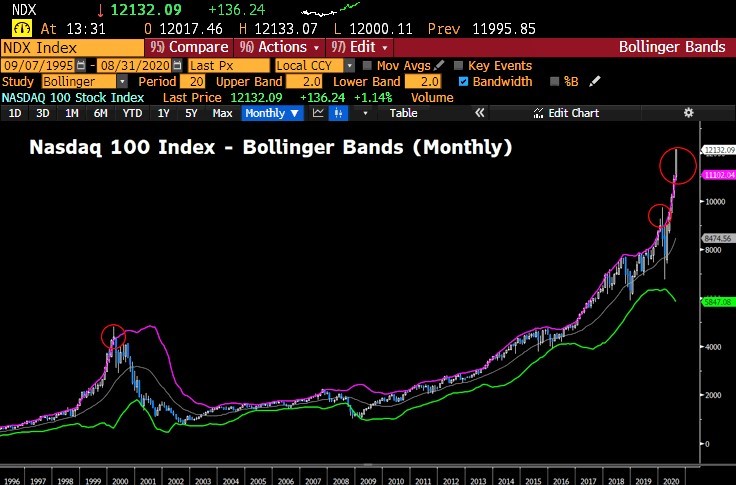
As you can see from the chart below, the Nasdaq 100 is overextended above the upper Bollinger Band on the monthly chart. This overextension is only on par with February 2020 and March 2000. The dam is about to break. A crash is coming later this year.
Conclusion
Declining breadth is a classic sign of the end of a bull market. Nasdaq is likely near a peak that will last several years. It wouldn’t be surprising if Apple and Tesla never reach their current levels again (once the peak is in). It’s tough to time the top in a euphoric market, but it would be surprising if it keeps going through the end of the year. We are in a similar state to early 2000.