6 Year Low In Consumer Confidence
It’s clear the decline in jobless benefits caused consumer confidence to fall because COVID-19 cases have been sharply declining this month. Plus, the stock market has been up. It's clear the coming election didn't alter confidence. It may have caused slightly more polarization, but probably didn’t impact the overall index.
Specifically, the consumer confidence index was down from 91.7 to 84.8 which was a 6 year low; it fell below the recessionary bottom. It fell sharply even with the 0.9 revision lower to last month’s reading. August’s reading missed the consensus for 93 and the low end of the estimate range which was 88.
Also, it appears the economy is slowing because of the lower benefits. That could reverse course in September once consumers start getting $300 per week. That’s not more than people would make regularly, but it helps. This situation is even more uncertain than this spring (in terms of when the benefits will end) which will cause consumers to save even more of the money.
On the other hand, Redbook same store sales growth in the week of August 22nd rose from -2.8% to 0.6%. Is it possible that consumer spending improved modestly, while sentiment was weak? It’s worth noting that the cutoff date for the consumer confidence survey was August 14th.
It’s possible consumers worried about the benefits and then spent more once they saw them announced. By August 14th, we only knew a couple states would be giving out the federal benefits.
Details Of August Consumer Confidence
Specifically, the present situation index fell sharply from 95.9 to 84.2. That perfectly lines up with the decline in benefits. Losing $600 per week is a huge deal. There was also weakness in the labor market. It was demonstrated with the recent job postings growth. Let’s see how initial jobless claims turn out. Expectations index fell from 88.9 to 85.2.
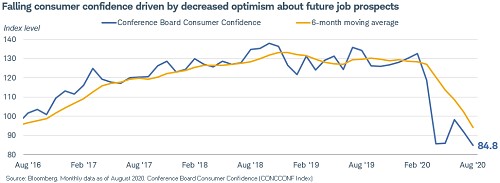
Consumers saying business conditions are bad rose from 38.9% to 43.6%. Those saying jobs are hard to get rose from 20.1% to 25.2%. Net percentage of consumers expecting the labor market to improve in the next 6 months fell from 8.3% to 7.2%. As you can see from the chart below, future job prospects aren’t bright. Similarly, those expecting an increase in income in the short term fell from 14.8% to 12.7%.
Small Business Closures
A small percentage of small businesses closed, but each closure will have a long term impact on the economy. Now we have a different survey. Obviously, who answers the survey and how the questions are asked play a role in the results. We can never be sure which is the most accurate. 21% of small firms said they will close if economic conditions don’t improve within 6 months.
Good news is conditions should improve because there might be a fiscal stimulus and COVID-19 cases are falling. It’s likely that the businesses saying they might close are the most impacted by COVID-19. Therefore, a decline in deaths to the point where people go back to normal would help these firms a lot. 19% will close in 7-12 months and 61% are doing fine.
Only 6% of firms said business is back to normal and 18% said things will go back to normal by the end of the year. However, the key point is the economy will improve by the end of the year without going back to normal. That’s enough to keep them in business, but they won’t be thriving.
Job Posting Details
Growth in job postings has been stagnant in the past 2 weeks. The chart below shows the specific areas showing weakness recently. As you can see, from January manufacturing job postings were down 38.6% in the week of August 14th which is the worst since May. That differs from some of the manufacturing readings we have seen recently. It will be interesting to see what the ISM report shows next week.
Professional and business services job postings were down 50.1% which is massive. That’s about as low as it has gotten this cycle. That’s much weaker than the July BLS report indicated. Finally, leisure and hospitality fell 54.1%. It’s certainly possible these numbers don’t reflect the labor market. We will get a better idea on Thursday and next Friday (jobless claims and BLS).

Huge Burst In New Home Sales
We seemingly live in a "dual class"society. There has been an increase in mortgages in forbearance because of the huge increase in unemployment. There has also been an increase in home buying because of the decline in interest rates.
As you can see from the chart below, new home sales in July rose from 791,000 to 901,000 which beat estimates for 774,000 and the highest estimate which was 800,000. This report countered the negative consumer confidence reading. Yearly growth in new home sales was 36%.
Midwest was up 59% and the Northeast was down 23%. People are leaving cities like NYC. That being said, it’s not as if there are ever a lot of new homes built in NYC. If anything, they are built in the suburbs where people are moving too.

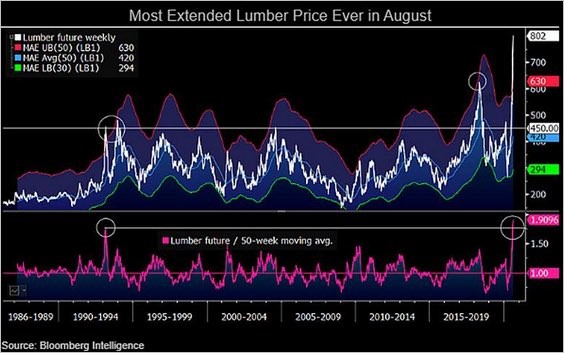
Median sale price was $330,600 which is 7% growth. There is a 4 month supply of houses. You can see how strong housing has been this summer by the chart of lumber prices. Housing market’s sudden increase caused this. Lumber prices are the highest ever and are the furthest above their 50 day moving average. This likely won’t last. You can’t do technical analysis on lumber prices. It’s just interesting to see.
Prices are determined by supply and demand. Surely, the largest spike in prices ever will cause supply to increase. Homebuilder stocks have actually been stronger than SaaS stocks in many cases. XHB homebuilder ETF is up 118.6% since the March bottom. Cloud index is only up 79.3% in that period.