Retail Sales Growth Improves Again
The number one story in macro is the impact of the decline in unemployment benefits now that we know the benefits will go out slowly, many people won’t get them, and even the people who do get them are getting less money than they got in July. We already know the economy is reopening.
A decline in COVID-19 cases is why the cyclical stocks rallied in the 2nd half of July and the beginning of August. Even though COVID-19 cases have continued to decline, the focus has shifted to the lack of a stimulus. That’s logical because there are 15.5 million continued claims and there were 6.6 million claims at the peak of the last recession.
Given the recent decline in initial claims, we can expect continued claims to fall in the report this Thursday, but it still won’t be close to 6.6 million. It will be 14.5 million at the lowest. Labor market is in worse shape than at any point in the last recession.

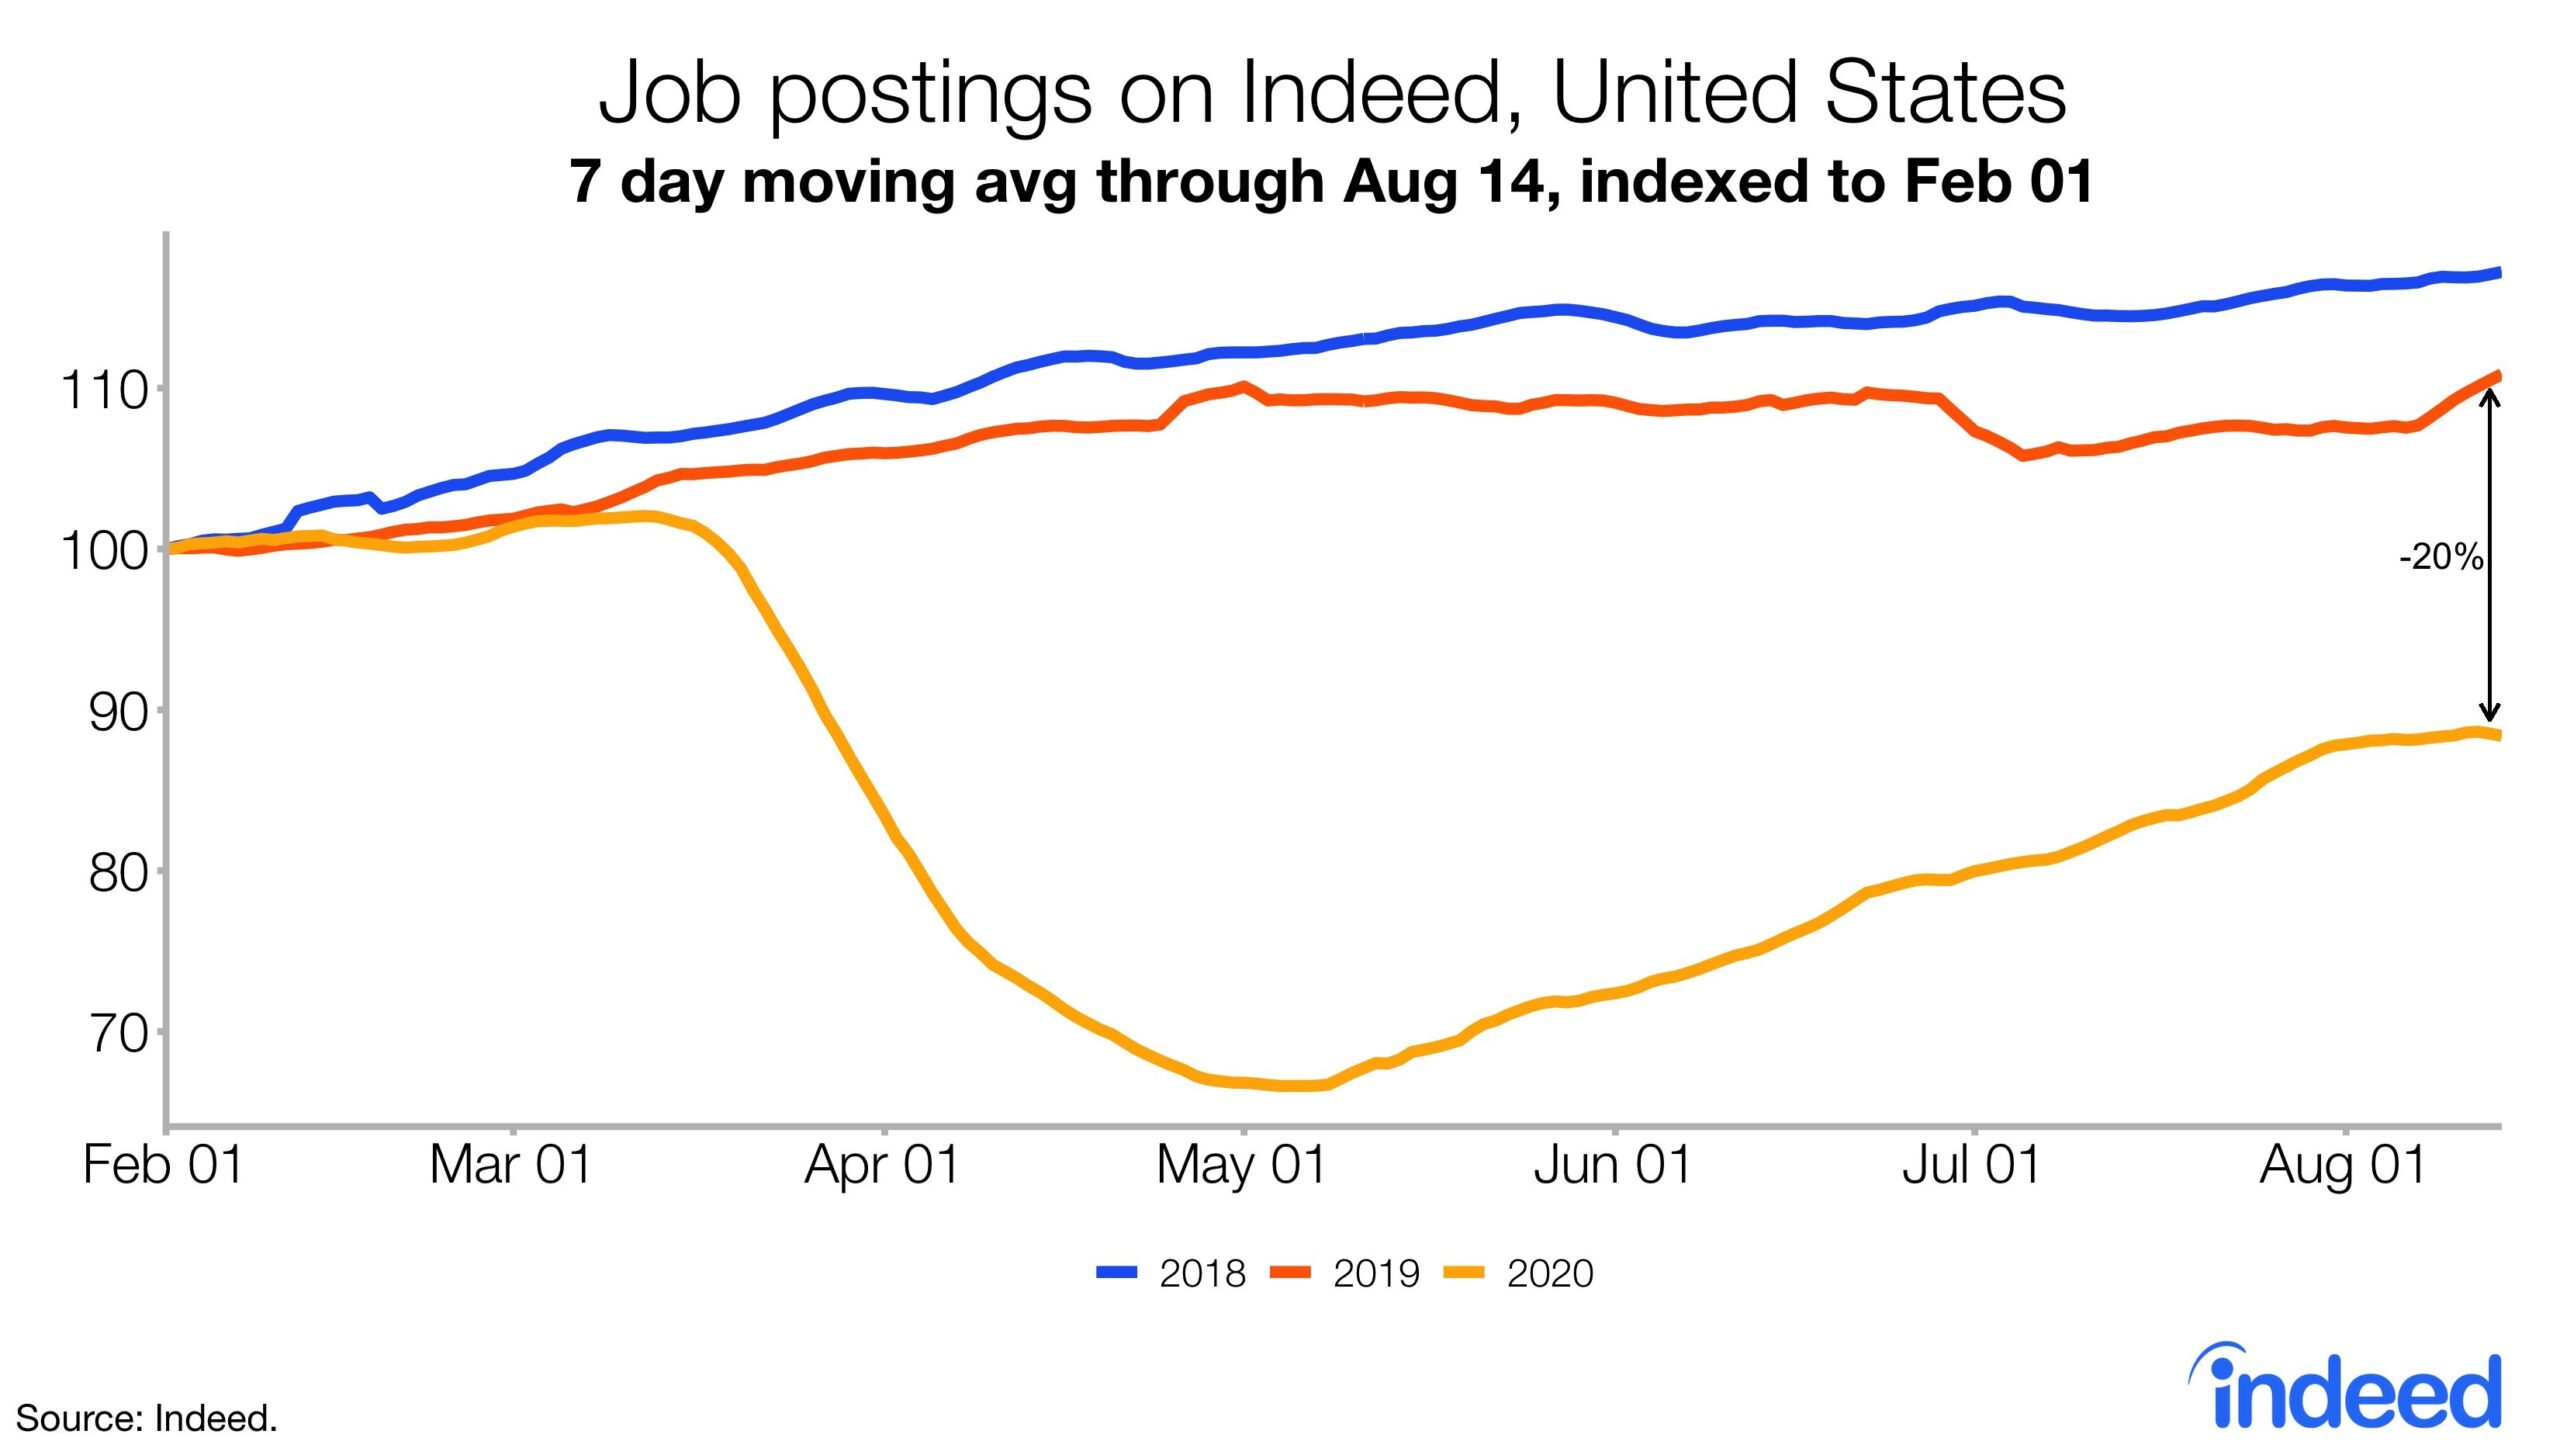
As you can see from the chart above, the 7 day average of job postings was down 20.3% from last year in the week of August 14th. Last week, the 7 day average was down 18.1%.
Keep in mind, there are usually fewer jobs created in August and last year had an unusual bounce. Even still you can see some weakness in the gold line on the right edge of the chart.
On the positive side, Redbook same store sales growth in the week of August 15th improved from -3.4% to -2.8%. That’s not a huge improvement and the number is still negative. However, it’s great to see the decline in benefits not hurting spending yet.
Personally, I’m expecting better jobless claims results than the Indeed forecast implies and the consensus expects. Specifically, initial claims are expected to stay exactly the same at 963,000. That’s the BLS survey week, so it’s very important.
Fund Managers Love The Global Economy
Fund managers bought European stocks, small caps, banks, and value over growth in August. They sold tech, U.S., and bonds. Therefore, it’s no surprise they are bullish on the global economy. As you can see from the chart below, the Bank of America survey shows a net 79% of managers think the global real economy will develop positively over the next year. That’s a 7 point improvement from the prior month.
It’s the highest net percentage since December 2009. 3 of the 4 past times fund managers were this bullish it was time to buy stocks.This situation will probably be like 2002 because valuations are too high.
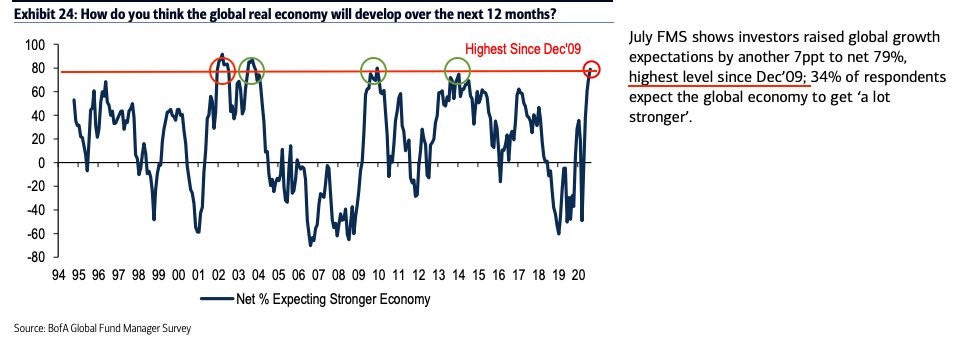
34% of managers expect the global economy to get a lot stronger. American economy outperformed most economies in Q2 because it issued a lot of fiscal stimulus. America might lag, but still improve in Q3 now that it won’t have an extra stimulus. Obviously, its still possible something gets passed in the fall. If economic data falters, the odds of another stimulus passing increases.
Problem is the stock market likely won’t fall if the economy gets worse because tech stocks are leading it higher. Congress doesn’t look at factor analysis when responding to the stock market. They see it rising and think the economy is in good shape even if cyclical stocks are falling.
Which Shape?
In the past 6 months, we’ve seen analysts, investors, and economists try to determine the shape of the recovery. It has been difficult because the economy is impacted by fiscal stimulus and COVID-19. This is much different from a normal recession. If there was a vaccine today, we would almost instantly have below 8% unemployment.
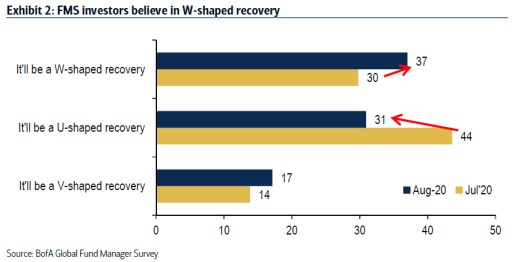
However, it’s not that simple. As you can see from the chart below, in August 7% more fund managers saw a W shaped recovery as it got to 37%. 3% more saw a V shaped recovery as it’s at 17%. Finally, 13% fewer saw a U shaped recovery as it’s at 31%.
This recovery may possibly be too foregone to be V shaped. There are certain stats that are V shaped such as the stock market, retail sales, and housing data. However, the overall economic recovery has slowed this summer. This wasn’t a V shaped recovery.
Unless a vaccine shows up within the next few weeks, it’s impossible for an economist in the future to describe this as a V shaped recovery. To be clear, this was the shortest recession ever and the initial part of the recovery was very strong.
There will be fits and starts to this recovery like we saw with the slowdown in July unless there is a vaccine. However, a true W shaped recovery involves a double dip recession which would only happen if a new wave of cases comes that’s more deadly than what we’ve seen.
A new wave occurred in June and July, but because deaths didn’t reach April levels, it wasn’t a disaster for the economy. If you had to pick from these, you'd say this is a U shaped recovery, but in reality it’s more likely a Nike check mark shaped recovery.
COVID-19 Update: Deaths Fall
In the 2nd week of August, there was a flattening of new COVID-19 cases. Starting in the past few days, cases have started to fall off a cliff again. Specifically, there were 43,999 new cases on Tuesday. That was down from 54,559 cases last Tuesday. That pushed the 7 day average below 50,000 for the first time since July 3rd.
Data looked good on Tuesday as there were 1,358 new deaths which was down from 1,504 which was the most deaths in this 2nd wave. The trend is starting to go in the right direction again as the 7 day average of deaths is 1,047.
It’s about to fall below 1,000 for the first time since July 28th. Deaths will fall for the rest of August as hospitalizations have been falling off a cliff.