Used Car Market On Fire
This recession and subsequent recovery have been highly unusual. One of the unusual parts has been the extreme demand for used cars. Social distancing has caused a decline in public transportation and airplane usage. Cars are being used to commute to work and for vacations. Used cars are especially in demand because they are cheaper.
Consumers are focused on saving money, so they aren’t as interested in buying new cars. Ironically, that’s causing a spike in used car prices which makes them less affordable.
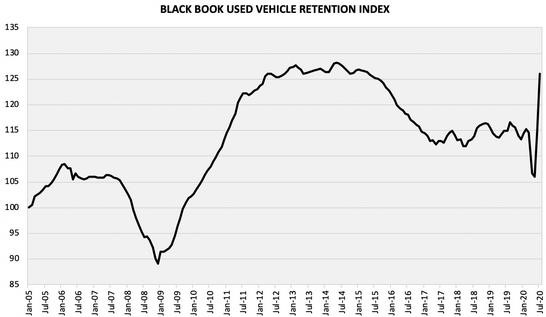
As you can see from the chart above, the used car index has spiked in the past few months (updated as of July) after initially crashing in the recession. It’s almost at its record high. This index is calculated by using the wholesale average value on 2 to 6 year old used vehicles as a percentage of original normally equipped MSRP. This looks at wholesale auctions of vehicles with average quality. It’s weighted based on registration volume and adjusted based on age, mileage, condition, and inflation.
When the online auto retailers Vroom and Carvana reported earnings, they mentioned how tough it is to acquire inventory. These businesses are in tough shape having to pay up for merchandise. Good news is online buying is up because of COVID-19.
CPI Inflation Rises
Black Book retention index rose 9% in July after rising 8.5% in June. There is a 3 month lag before it impacts CPI which means the impact will be seen in September and October. Each of those spikes will cause a 0.3% increase in core CPI which is a pretty big deal. They have a large impact since a car is a large expense. Just like PPI, CPI rose in July. This time, beating the consensus was expected because of the PPI report.
Fed believes rising inflation is a good thing. It would be interesting to look back at this moment in a few years since the Fed is going full throttle towards trying to increase inflation, yet the market doesn’t believe it. This is like how we all know the economy is going to get back to normal activity in a few quarters, yet traders speculate that SaaS stocks will have practically indefinite sales growth.
Specifically, monthly CPI was 0.6% in July which doubled the consensus and was the same as June. Yearly CPI was 1% which was up from 0.6% as you can see from the chart below. This beat estimates for 0.8%. Monthly core inflation was 0.6% which tripled the previous reading and the consensus. Finally, yearly core CPI was 1.6% which was 0.5% above the consensus and 0.4% above June’s reading.
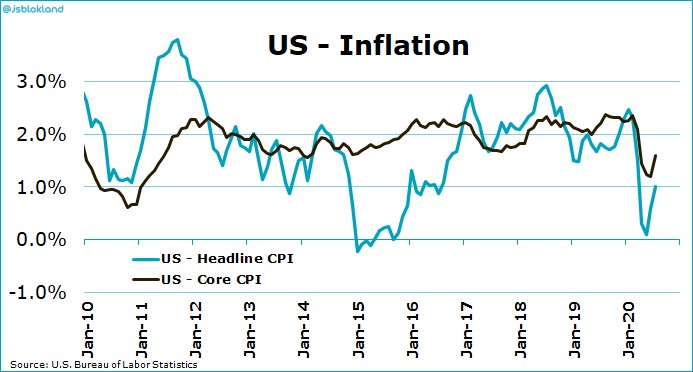
As the chart shows, for the most part, core CPI has been near 2% since 2011. This was a rare decline which is correcting itself. If the Fed used core CPI to measure its success, it wouldn’t be far off from its 2% goal. Because it uses core PCE inflation, it constantly misses its target. It will be interesting to see the reactions once inflation perks up because of the cyclical recovery.
No one cares that the Fed is fine with higher inflation now because it’s not an issue. If the economy recovers solidly by next year and we start seeing consistently above 2% core PCE inflation and the Fed stays dovish, it might be an issue.
This is very tough to forecast because fiscal policy might change if the Democrats win the election. Currently, Biden has a 59% chance of winning the election. First presidential debate is on September 29th. The market is anticipating volatility this fall. It will be interesting to see how all the new retail traders react to it. Best guess is that they will be erratic.
Details Of CPI
Food inflation was 4.1%. It was driven by food at home inflation which was 4.6% versus food away from inflation which was 3.4%. Food away from home inflation doesn’t matter as much since demand is lower. Meats, poultry, fish, and eggs drove food at home inflation as their prices were up 8.4%.
Second was non-alcoholic beverages and materials at 5%. Full-service meals and snacks only had 2.9% inflation which makes sense because in a COVID-19 world, going out to a fancy restaurant is less popular. Energy inflation was -11.2% as energy commodities inflation was -20.2%.
Just like in the past few years, within core inflation, commodities excluding food and energy had negative inflation as it was -0.5%. Commodities have had historically bad performance. Apparel prices were down 6.5% as people didn’t need new clothes because they didn’t go to as many gatherings because of COVID-19. As usual, tobacco and other smoking products had the highest inflation as it was 5.2%.
Core services inflation was 2.3%. Core inflation was low because of shelter inflation. Shelter inflation was 2.3% which was above core inflation, but it could have been higher (it fell 0.1%). Before the recession it was hovering in the 3% range. Transportation services inflation was low as people traveled less. It was -3.7%. Lyft reported a 61% decline in sales this past quarter. That tells you how much travel fell.
Medical services inflation was 5.9%. It was high like the PPI report suggested it would be. It was actually down 0.1%, but that’s still very high. It’s definitely going to come down in the next few months as the comps get tougher. It started increasing in May 2019. In this report, the comp was 0.5% higher which means the 2 year stack was 0.4% higher.
August report has a 1% higher comp as it is 4.3%. Medical care services inflation is unlikely to increase next month. This entire sector is going to change if COVID-19 cases fall because people are going to get the elective surgeries they put off during the pandemic.