Historic Insanity
CNN fear and greed index rose 4 points on Thursday to 74 which is just below extreme greed. S&P 500 is 9% above its 200 day moving average. It was 11.5% above it before the pandemic. It seems like we were approaching euphoria this year before the pandemic and now the trend has accelerated because of dip buyers and retail investors who have extra cash and nowhere to spend it.
The economy is in bad shape (but improving) yet people have money to throw away on stocks. A crash in the stock market would hurt the economy even further. There could be a crisis of confidence if the Fed can’t save the market in the next crash.
NAAIM exposure index fell from 97.44 to 94.55 which means it has been above 90 for 4 straight weeks. Last time it was above 90 for 4 straight weeks was from December 2017 to January 2018 which was a couple weeks before the short VIX trade exploded.
We don’t exactly know when the tech bubble will explode, but it wouldn’t be surprising if it occurs in August. We are getting very close to the apex. We're now seeing a few people who normally aren’t phased by rallies switch into the bear camp because it has gone so far.
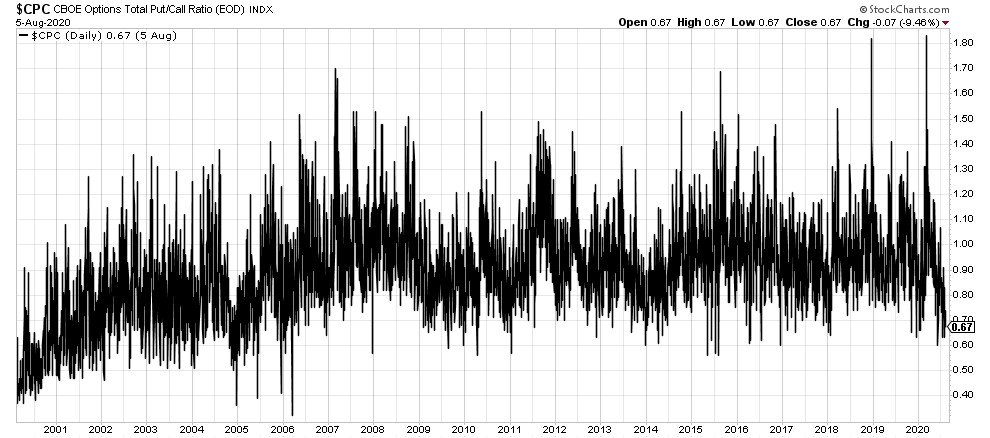
Apple is larger than the entire Italian economy. FAAMNG stocks are now 25% of the S&P 500. Nasdaq’s 20 day moving average has increased 83 straight days which is 6 days shy of the record. As you can see from the chart above, the put to call ratio has fallen to 0.59 which is a rare reading. CBOE skew index is high which means many investors are buying puts for protection.
Extreme Speculation In Precious Metals
Heading into Thursday, gold had increased 13 of 14 days for the first time ever. It increased again on Thursday as the yellow metal got to $2,070. Even if that’s the peak, I don’t think historians will call this a double top. Regardless of that terminology, I think it’s very close to a top.
Even long term gold bulls think it has run too far. Reality is gold always runs quickly and too far when it rallies. When it corrects like the bulls want, it won’t be the healthy 10% correction that they desire. This isn’t the stock market in a healthy bull market.
This is a precious metal that can easily fall 50% if sentiment changes. It wouldn’t be surprising if it fell 20% on a 10 year treasury selloff in which the yield got to 1% like I’m predicting. As of Friday morning, the 10 year yield was at 53 basis points. It may have bottomed.
It really should bottom because daily deaths from COVID-19 are starting to fall and the stimulus is coming. And it's weird that the stock market expects a stimulus and the bond market doesn’t. Clearly, one is coming. A weak labor report will help spur a deal.
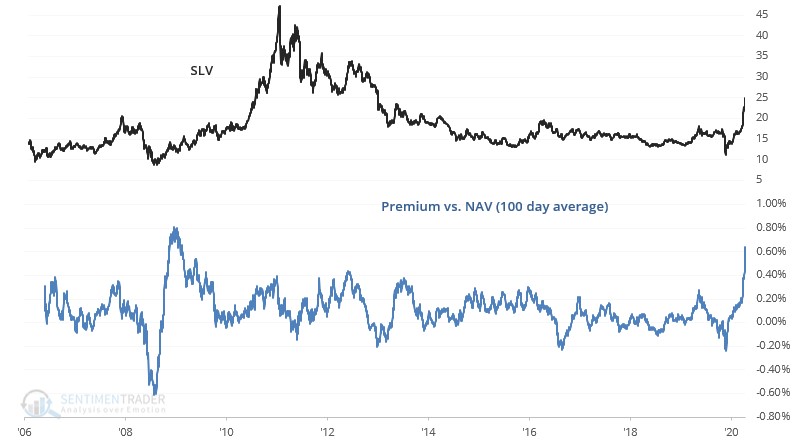
Gold and silver ETFs are way out of line with the amount of precious metals they are backed by. They are much higher than their net asset values. We saw this occur in bitcoin in 2017 because investors were so excited to buy the ETFs which are easier to trade than the actual currency. You need to create a separate account to buy actual bitcoin.
As you can see from the chart above, the SLV’s premium to its net asset value is the 2nd highest ever. The GLD’s premium to its net asset value is its 3rd highest ever.
Furthermore, the GLD has usurped the VOO to take the top spot in year to date flows with $21 billion. That’s 9% of all ETF flows which is high considering that it only made up 1% of total assets under management. IAU ETF has the 8th highest flows.
Both gold ETFs are doubling their annual inflows. Gold bugs love to say gold should be a certain percentage of assets under management. That’s ridiculous. Gold doesn’t produce anything like a business does. You can argue just as well that almost no investors should own gold.
2.88% 30 Year Fixed Rate
30 year fixed rate fell to 2.88% as the 10 year yield is near its record low. Housing demand will be helped by this. We can only imagine how strong housing would be if the unemployment rate fell below 8% and rates stayed below 3%. That’s highly unlikely because treasuries should sell off as the economy improves.
Also, keep in mind a strong housing market causes prices to rise which causes demand to fall. Even if 30 year fixed rates rise to 4%, there won’t be a housing bust like in the 2000s. That being said, demand would fall and prices in some cities would fall.
Details On Thursday’s Rally
S&P 500 rose for the 5th straight day as it increased 0.64%. Nasdaq increased 1% which was its 7th straight rally. Russell 2000 fell 0.1%. Most would rather the small caps fall when the tech stocks rally because when the tech stocks crash, it would be nice if the small caps didn’t crash with them.
Apple was up 3.5% as its market cap reached $1.95 trillion. It has a 35 PE ratio which means It’s likely about double where it should be. 11% growth on a hardware business normally gets a 10 to 15 multiple. Let's be generous and say 15 to 20 because it’s Apple.
Worst sectors were energy and healthcare which fell 0.7% and 0.6%. Best two sectors were obviously tech and communications services which were up 1.5% and 2.5%. A big winner on the day was Facebook which increased 6.5% because it came out with Reels which is a Tik Tok competitor.
We’re now at the point where any growth stock that hasn’t rallied as much as the hottest stocks is getting a lift. That might be why Mastercard rose 4.3% on Wednesday.