3 Explanations For Monday’s Drop
Monday looked to be a positive day for stocks before the market reversed in the afternoon. It was like a mini flash crash except it was easy to foresee because the tech sector and Tesla stock had been so overbought. In fact, heading into the day, Tesla’s 14 day RSI was 85.25 which is one of the highest readings I’ve ever seen.
There are 3 potential reasons stocks fell. First is the closing of outdoor activities in California. Second is the potential for 4 vaccines to be produced later this summer, with late stage human trials starting at the end of this month. The theory is if a vaccine comes out next year, these work from home and online shopping stocks will need to be rerated lower.
However, we have no evidence that any of the vaccines will be successful. It doesn’t matter how many vaccines are tested and produced, they still might not work or they might work for a limited period. Hope is to start giving people vaccines early next year.
Stocks likely fell because they were too overbought and too expensive. One key used was the huge 24% crash in Arcimoto stock. Some of the other stocks like Fastly fell 12%. Most of those crashes were before the overall market fell. Essentially, they were cracks in the foundation of this rally in tech and EV stocks. Arcimoto and Fastly are now down 33% and 19% in the past 2 days. This selloff is just getting started and they are already down huge.
When they bottom, they might be early signals for the overall market. They are already down so much. If the Nasdaq was to fall 5% to 10%, they could fall hugely. At a certain point, they will hit rock bottom; it’s just very far from where they are now.
Big Reversal Day
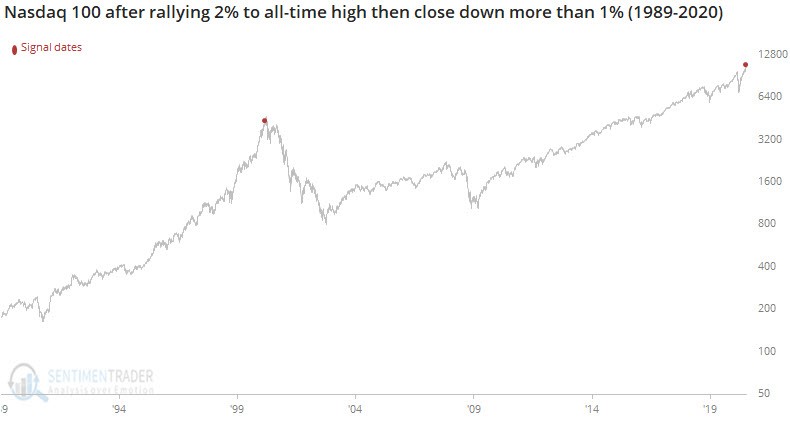
Over one quarter of the Russell 3000 fell 5% from their intraday high. Nasdaq closed more than 4% off the high on Monday while also making a new high for the 2nd time in history. The other time was January 24th, 2000 which is very ominous. Furthermore, the Nasdaq 100 rallied more than 2% intraday to set a record high and then reversed to close down more than 1%. As you can see from the chart below, the only other time it has done this is March 7th, 2000. These are 2 ominous stats.
If people want to get out of a momentum driven market, the momentum stocks can fall sharply. They already did on Monday as Shopify fell 6%, Amazon fell 3%, and Tesla fell 3%. Tesla is the most important stock in this market because it’s the most overvalued compared to its size. In other words, there are some smaller companies that are more overvalued, but no bigger companies.
At one point in the day, Tesla was the 10th largest company in America, so it’s very easy to make that claim. Investors certainly think Tesla is the most overvalued as it has a short interest of 9.47%. That’s not high compared to where it was last year, but it’s incredibly high compared to the other big cap names.
The 2nd largest short interest among the top 25 stocks is Netflix at 2.55%. Netflix has been dogged by its negative free cash flow for years. Tesla is about 4 times as controversial.
Market Had Momentum
A lot of random stats that you wouldn’t normally look at are flashing warning signs which should scare the buyers of cloud stocks. However, they are ignoring them which is what you’d expect for a euphoric top. CLOU cloud index fell 5%, while the KBW regional bank index rose 1.4%. This was a rare situation where value stocks outperformed.
Nasdaq was up more than 1% in the afternoon, while the VXN was up more than 8%. This never happened before. Last time the VIX closed above 27 while the S&P 500 was within 5% of its record high was April 2000. That speaks to the speed of this rally.
As you can see from the chart below, the Dow Jones Neutral Market Momentum index is coming off its best 20 day gain on record, going back to 2002. The other 2 times this was reached were the previous 2 market bottoms. Clearly, we aren’t at a bottom.

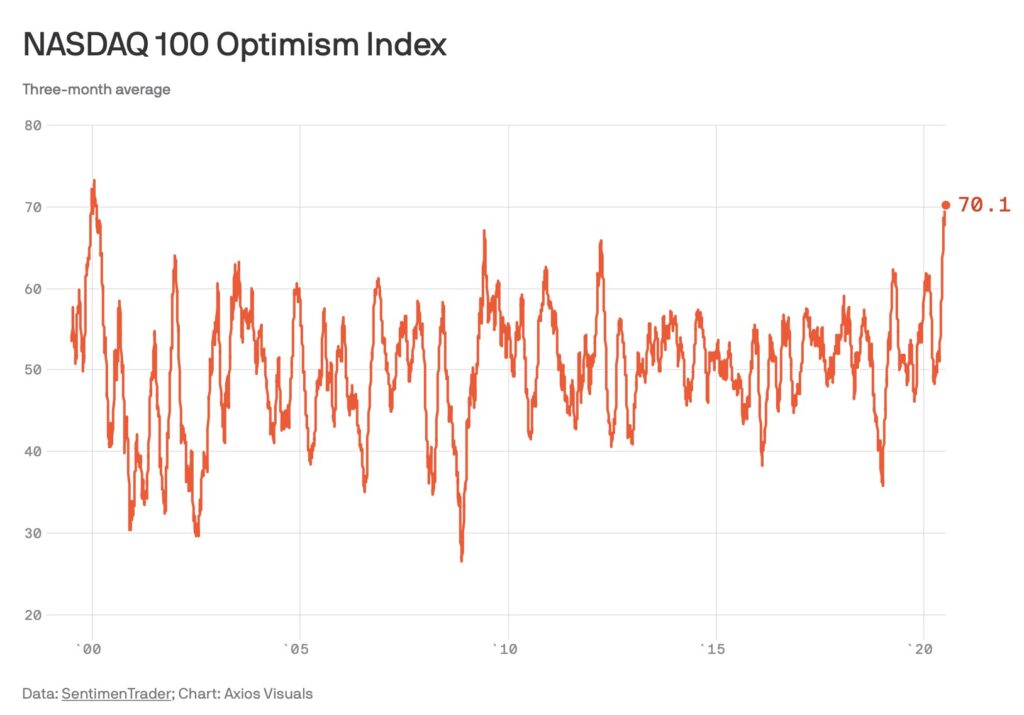
Extreme Nasdaq 100 Optimism
Obviously, we are seeing the Nasdaq reach extreme levels. New speculators in the tech and EV stocks say value investing is dead. It’s one thing for the financial press to mention it. It’s another thing for people with little experience to claim Warren Buffett doesn’t know what he’s talking about. They have extreme confidence despite the fact that they know next to nothing. They have no experience.
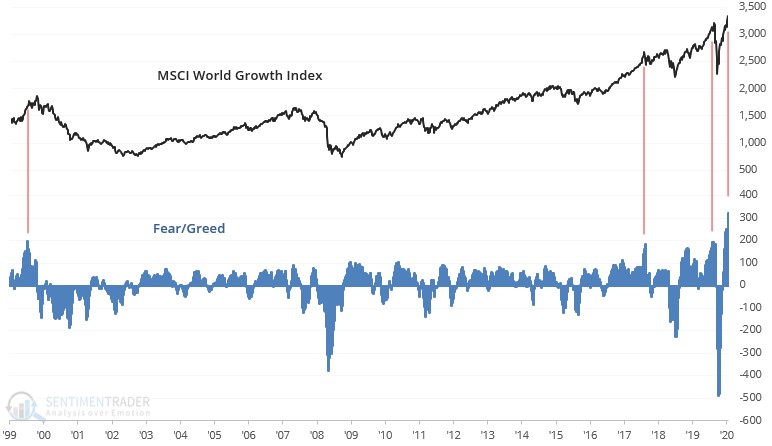
As you can see from the chart below, the MSCI world growth index’s fear greed indicator is at the highest level ever. It’s higher than the peak in 2000. We have a combination of a strong rally coming from an oversold market, with central bank stimulus, and increased use of online platforms because of the virus. This has created the mother of all bubbles.
As the chart below shows, the 3 month average of the Nasdaq Optimism index is at the highest level since 2000. It looks like the peak was around 73 in 2000. It’s at 70.1 now. Number of media stories mentioning the word bubble is the highest since April 2000.
The index below is based on trading activity in put options versus call options, future volatility expectations, price behavior, and the average discount of the fund (Nasdaq 100) to its net asset value. Future volatility expectations are high compared to how well stocks have done. And the put to call ratio is quite low.
Also, the number of S&P 500 components with an over 10 times price to sales ratio is the highest since the peak of the tech bubble.