Optimistic About COVID-19
Investors are becoming more optimistic about the COVID-19 situation. Data on COVID-19 growth in some of the worst hit states has begun to get worse at a slower rate. Furthermore, we have experience on how to stop the spread and treat people better. If we already know how to stop the spread, why did it spike in a few southern and western states?
Politicians and people in this area weren’t cautious enough. It’s human nature to become less disciplined when a negative situation hasn’t deeply affected you. Now that it has become more serious, people in these areas are taking more precautionary measures and politicians are mandating people wear masks.
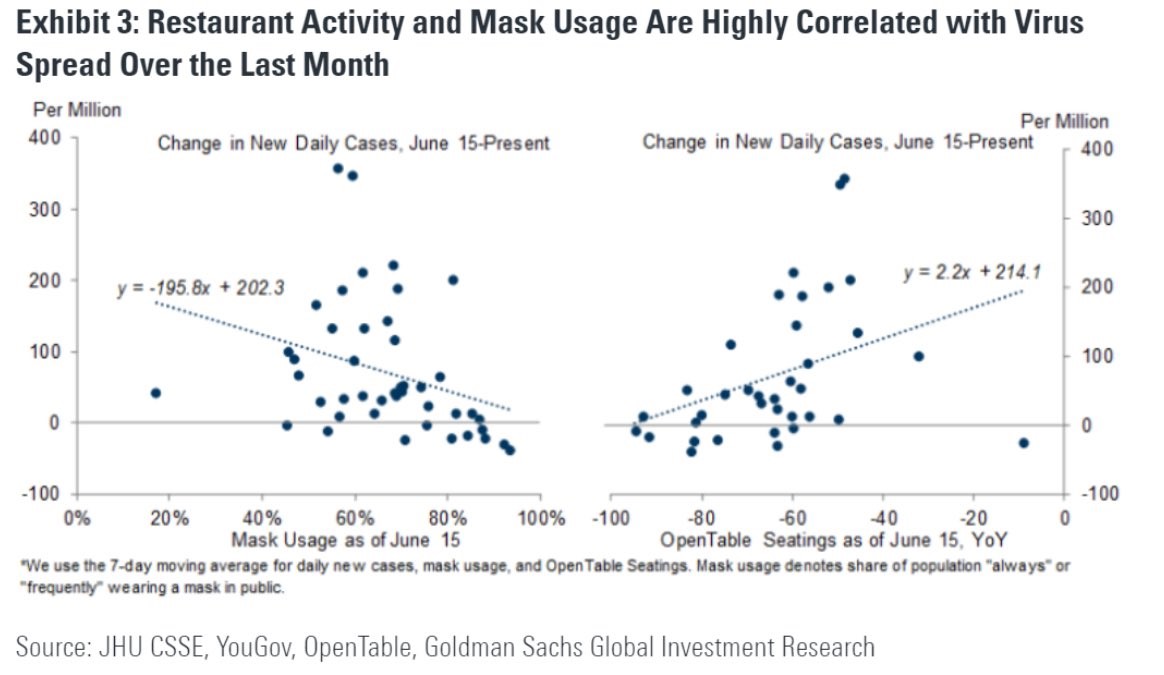
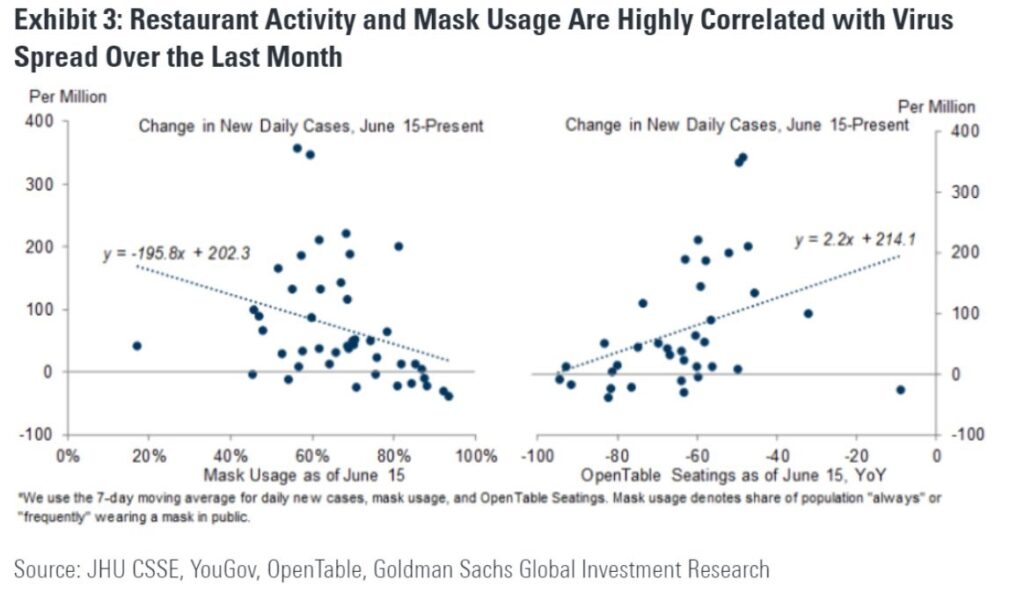
As you can see from the chart below, mask usage is inversely correlated with virus spread, meaning the more people who wear masks in a state, the less spread there will be. That's not to say that wearing a mask is the holy grail, but it should help at least somewhat. Another chart shows growth in restaurant bookings is highly correlated with the spread of the virus. That’s why it could be said that if restaurant sales fall temporarily, it’s actually a good thing.
California Closures Spook Stocks
On Monday, the California governor ordered all dine in restaurants, bars, movie theaters, museums, and other indoor businesses to close. The stock market viewed this as bad news in the short term. That’s an understandable reaction, but some disagree. A spike in new cases in June and early July was the bad news. This action is good news because it means the COVID-19 spike will be brought under control again. California is 15% of the US economy, so it is very important. Once it reopens in a few weeks, we will see renewed improvements in the economy.
When the virus is under control, the economy can have a full rebound. When restaurant bookings go down and when mask usage goes up, there are probably other factors in play which help slow the spread. If people in a state with a lot of cases use masks and don’t dine out, they are more likely to be taking other precautionary measures as well. We don’t know what they are specifically, but as long as they are taking them, the situation will improve.
Hot Spots Get Better In Rate Of Change Terms
Hotspot states are beginning to see signs of improvement in rate of change terms. That might be why the market was spooked by California’s closure; it wasn’t expected. As you can see from the chart on the left, California’s 7 day average of new cases is starting to plateau. On Sunday, Florida dumped 15,300 new cases. Sometimes the data is lumpy. Investors don’t expect that number to be matched. It had 12,624 new cases on Monday.
New York City had its first day since the virus started where there were no deaths. That’s a huge accomplishment. New York had so many deaths per capita and per case because it dealt with the virus earlier in the outbreak when we had less understood it less. Also, the hospitals were overwhelmed. That’s why it's good to monitor hospitalizations.

As the chart on the right shows, Florida has finally started to report its results. It’s no surprise they are quite high. Good news is each of the hot spots listed is seeing its hospitalizations stabilize. Arizona has been the hardest hit. Because Arizona was the first hotspot to show big problems, it’s the first state that’s seeing its new cases per day top. It’s great that all these hotspots still have lower hospitalizations per capita than the peaks New York and New Jersey had in the spring.
In the near term, the market’s biggest negative catalyst might be Texas adding restrictions like California. The biggest positive catalyst should be Arizona continuing to see signs of improvement because that means the other states will soon follow.
Global Lockdown Ending
The global lockdown is ending even though the media makes it look like it’s getting worse because of the spikes in the south and the west of America. Even though California is seeing some indoor activities closed, these restrictions aren’t as draconian as they were this spring. If the situation worsens, we can see shutdowns, but we're not expecting them.
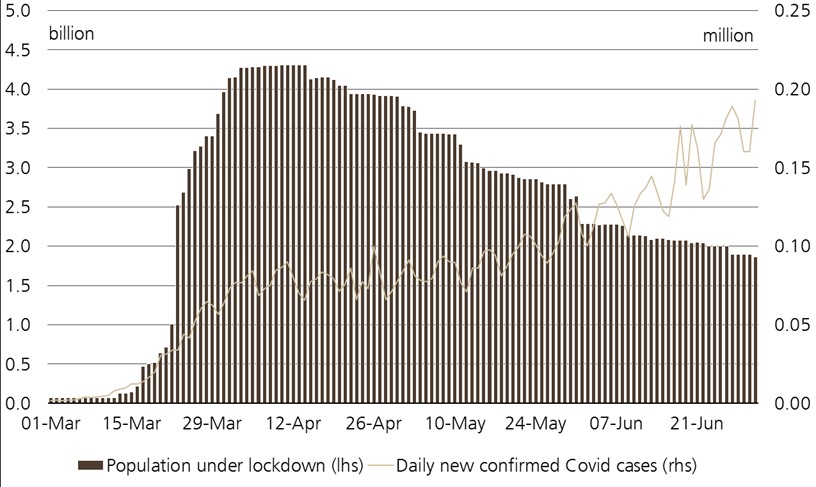
As you can see from the chart below, the global population under lockdown has fallen from about 4.25 billion to about 1.75 billion even as the number of new COVID-19 cases has spiked. This is slightly misleading because deaths haven’t spiked. Obviously, it’s still not good that they have plateaued rather than fallen. Global hotspots are Brazil, India, and America.
Is This The End Of FAANG?
Obviously, we don’t know when the FAANG trade will end. It has been going strong for over a decade, with sharp outperformance for the past 6 years. This is like the Nifty 50 rally in the 1960s and 1970s. Just because this trade will eventually end in despair doesn’t mean you want to avoid them.
If there are signs it could end, they need to be taken seriously because the downside is large. They are extremely crowded trades. Amazon is one of the most crowded investments many have ever seen.
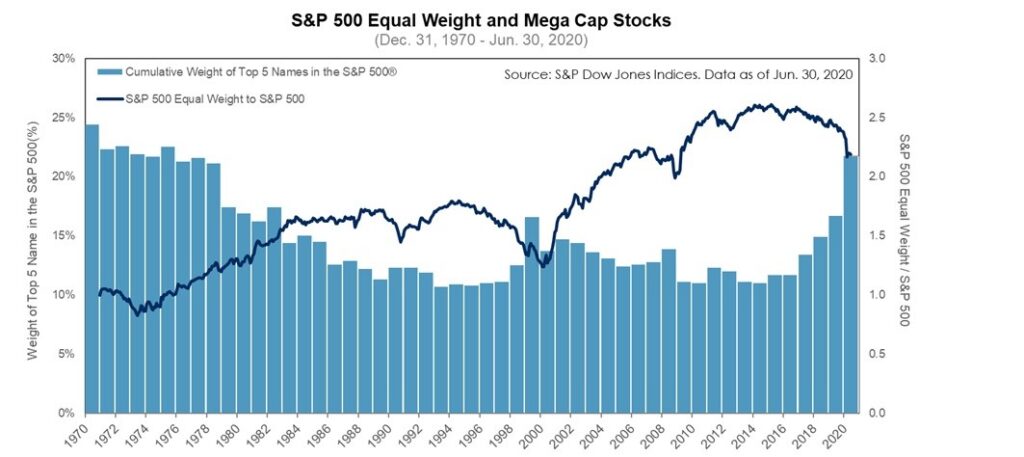
As you can see from the chart above, when the top 5 names in the S&P 500 gain a large market share, such as in the 1970s, the late 1990s, and now, the equal weight S&P 500 index outperforms the normal market cap weighted index. Their weighting is quite high now. A question is if now is the time to abandon ship. Lately, these names have been frothy.
The main question is if they are set to underperform for a few months or if this trade is over. Investors will be watching how their Congressional hearing goes on July 25th. If it goes poorly, that could be the beginning of the end for these hot stocks.