Nasdaq 8 Day Winning Streak
This is the Nasdaq’s world and we’re just living in it. The stock market overall isn’t extremely overbought. Some think it’s modestly too high. On the other hand, the Nasdaq is in a legitimate bubble. In other words, we can see the S&P 500 and the other major indexes falling modestly while the Nasdaq crashes. We could see the S&P 500 fall 5% and the Nasdaq fall 15%. That’s a crazy claim with the index up 8 days in a row, but the euphoria is way out of line.
If the S&P 500 fell 5% in a massive tech decline, that would actually mean the rest of the market rallied significantly because of how large tech is as a percentage of the index. Remember, the FAANMG names alone are 24% of the index. When you add in the other smaller names, it’s more than a third of the index. Tech is 27% of the S&P 500.
The thing is Facebook, Netflix, and Amazon aren’t in that sector. They are in communication services and consumer discretionary (latter 2). Software ate a good chunk of the S&P 500. The S&P 500 has a PE multiple of 20 without these big tech stocks; it has a 2.4 higher multiple with them. This index is modestly expensive without the high flying tech names, while the Nasdaq is extremely overheated.
Nasdaq is at a record, while the S&P 500 is about 7% below its record. That’s the largest spread between the index’s relative to their record highs since February 2000 (the Nasdaq peaked in March 2000). Before that, it happened in 1980 when there were no internet stocks. That's not to say there will be as big of a decline in the Nasdaq as there was in the early 2000s, but it is a more relevant comparison than 1980.
Nasdaq’s year to date gain versus the S&P 500 and the Dow is the highest since 1983 which is impressive because that means it has outperformed more than at any point in the tech bubble. A gap between the S&P 500 and the Dow is the largest since 2002, but that was when the Dow was ahead. Dow is underperforming wildly because of Boeing’s weakness and because it doesn’t have Amazon, Netflix, Alphabet, and Facebook. Both indexes still don’t have Tesla, which the Nasdaq has.
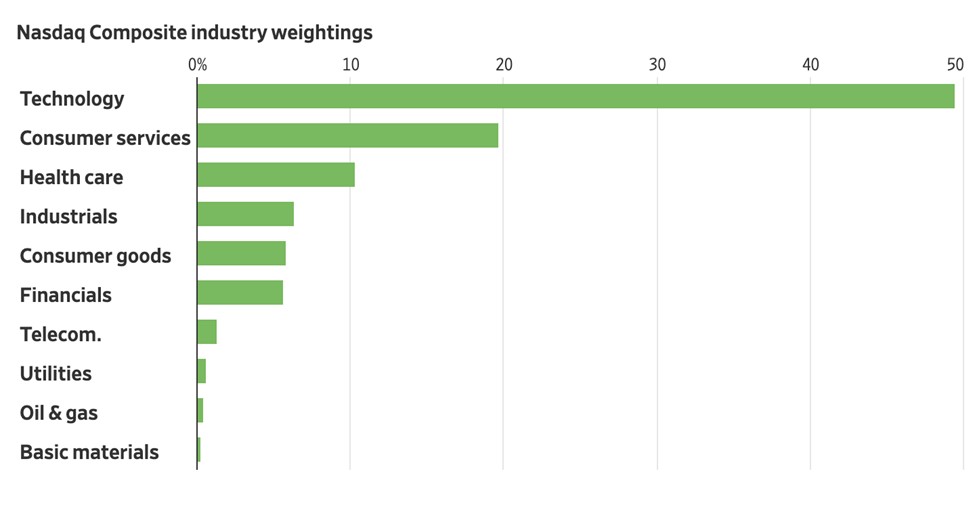
As you can see from the chart above, the 50% of the Nasdaq is in tech and 20% is in consumer services. Plus 10% is in healthcare with a lot of biotech names included. Nasdaq is almost perfectly weighted for this market since it has almost no basic materials or oil & gas.
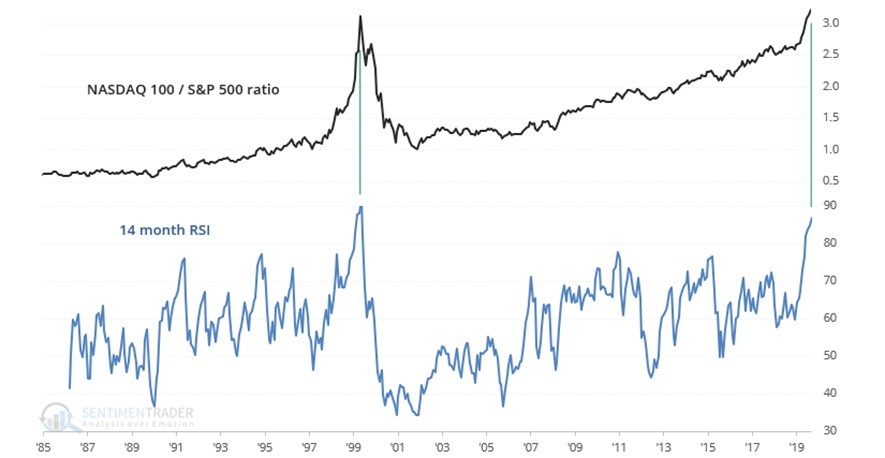
As you can see from the chart below, the ratio of the Nasdaq 100 to the S&P 500 is about the same as it was at the peak of the tech bubble. 14 month RSI of this ratio is in the high 80s, while it peaked at 90 in 2000. Some are predicting a sharp decline in the Nasdaq, but not as big as what occurred in the early 2000s.
Bankrupt & Airlines Stop Working
The stock market has changed in the past couple weeks. Bankrupt stocks and the airlines haven’t been working. Cloud is the only game in town. Hertz is down 78% since June 8th as its bid to issue stock didn’t work. Others such as Chesapeake, Oasis, Whiting, and JC Penny look the same. JCP Penny is down 51% in the same time frame.
Since June 8th, the JETS airline ETF is down 21%. These were Dave Portnoy’s favorites. This (long) trade is likely over because these firms are raising a lot of debt. They won’t easily recover from this. It will take many years to get back to previous debt levels. Spirit Airlines, his favorite stock is down 26.5%.
Cruise ships have also been in the doldrums as Royal Caribbean stock is down 28% since June 8th even though it was up 4.8% on Tuesday.
Personally, I hate the "barbell" investing approach. That’s when investors buy the stocks most at risk to COVID-19 shutting down the economy and the stocks least at risk to this. However, it's not good to be as bearish on the ones hurt by it as I once was because they are down a lot.
Cloud stocks are generally better businesses than the cyclicals, but there are plenty of money losing stocks in this bunch. CLOU cloud ETF was up 0.33% on Tuesday and it’s up 11.7% in the past month. These gains can’t go on.
Day Traders Gone Wild
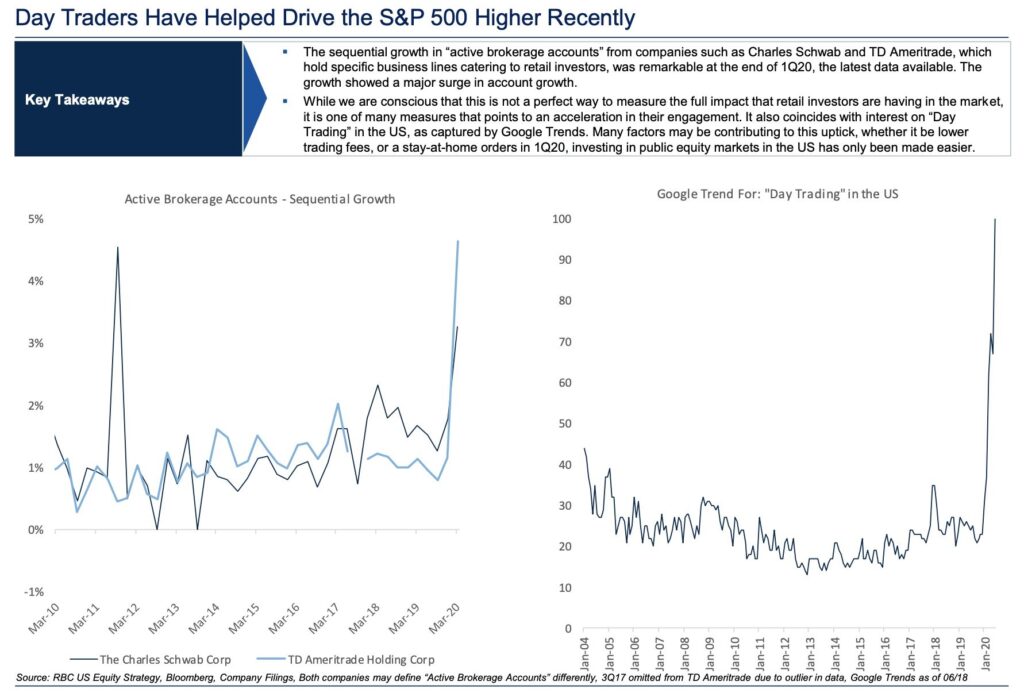
There have been millions of new retail brokerage accounts created this year; these traders are trading more because of the decline in commissions with many being free. The chart on the left shows the huge sequential growth in both TD Ameritrade and Schwab accounts.
It will be exciting to see the spike in Robinhood accounts in Q2. Over double the 3 million accounts created in Q1 were created in Q2. There has been a tripling in Google searches for day trading in the past few weeks which is a bad sign. Personally, I wish we had data that goes back until 1999.
Spike In Analyst Upgrades
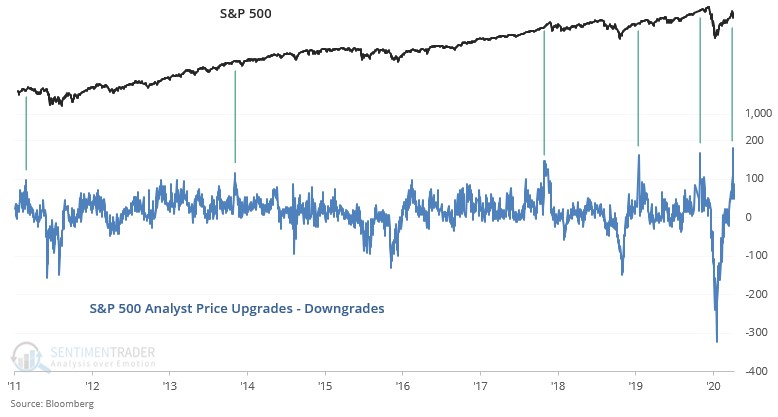
Analysts do great research, but they are bad at timing the market. Now they are chasing stocks because their targets were unrealistically pessimistic in the early spring. The chart below shows the difference between price target upgrades and downgrades is the highest ever.
As you can see, every time analysts chased stocks, they fell in the following 2-3 months. There are 4 such examples since 2011. When you combine this chasing with the market’s recent great run, the euphoria among retail traders, and its high multiple, it’s clear a pullback is coming.
That being said, the stocks not in the momentum internet group might not fall sharply. Let’s put it this way. It wouldn’t be good to sell a consumer staples stock because the Nasdaq is in a bubble.