Extreme Speculation Is Back
This market is incredible. Just after we had a big 5.9% decline on Thursday, the market is back to its euphoric ways. You can see it by following retail traders. Psychology is very funny. You never know what will change the tide. If you told investors about a market that was extremely euphoric and then had a massive 5.9% decline, we would expect to see the momentum reverse quickly.
However, dip buyers came in like nothing happened. Retail traders haven’t even flinched. You can tell hedge funds feel the same way because they were very long U.S. stocks in the June BAML report. They move markets, so the sentiment can be seen in the price action.
People who are extremely bullish are calling for new highs now that the market has been supposedly wiped clean of speculation. That’s not how it works. If stocks fall 7% and then recover over the next few days, nothing changes. Valuations don’t change. You can’t just say every negative is already priced in if stocks are higher.
In other words, stocks shouldn’t be above the February high. COVID-19 is still a negative. Markets don’t typically recover all the recessionary losses in 3-4 months. The stock market is once again extremely expensive unless you expect 2021 earnings estimates to rise significantly. 2021 PE is 19.7. It’s fairly obvious the market is expensive.
Anytime you see a parabolic chart, you can assume the underlying asset is too high. Obviously, there are some examples where the original price was very cheap. That’s not the case here. I think stocks were fairly valued in mid-May before this ramp started.
Small Traders Love This Market
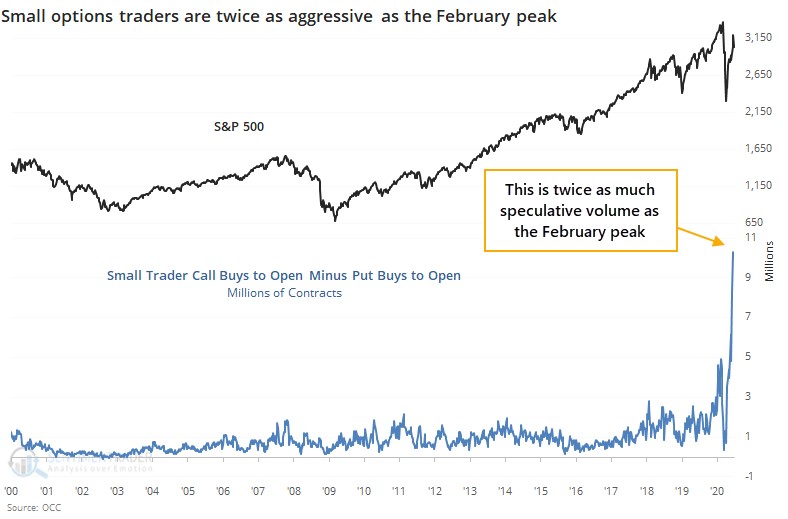
The fact that retail traders ignored the big decline on Thursday shows how euphoric sentiment is. This market is made of indestructible Teflon. As you can see from the chart below, small trader call buys to open minus put buys to open are twice the level of February.
That’s because there was a huge spike in new retail accounts following the start of the bear market. Large buyers are joining in on the fun as large trader call buying is the highest since the early 2000s. When you combine the two, total speculative buying is at a record by a wide margin.
Big Decline In Institutional Cash
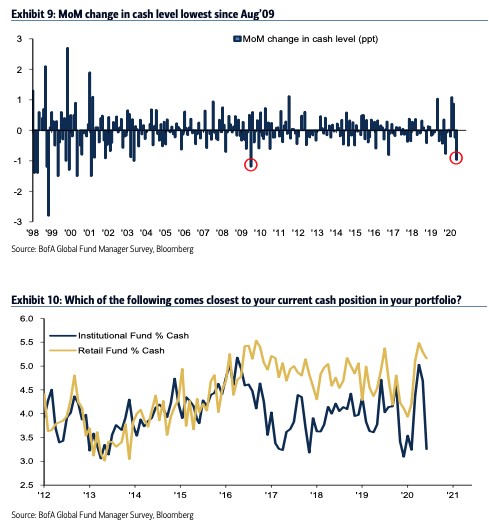
As you can see in the chart below, institutions increased cash in March and April as they sold stocks. Their cash percentage was the highest since early 2016 at the peak. In June, the percentage of cash fell from 5.7% to 4.7% which was the biggest monthly decline since August 2009.
Hedge fund net equity exposure exploded from 34% to 52% which was the highest since September 2018. Obviously, we know that there was a 20% correction in Q4 2018 following that spike.
Stocks usually rally when they have done well recently and funds are underexposed. That causes them to chase the market. We saw that situation in the May report as fund managers were caught underexposed even though stocks had rallied significantly off the March low. This caused performance chasing starting in mid-May.
We are approaching the end of that trend. And the last buyers of stocks at the highs in June are shooting themselves in the foot. They finally have their much-desired U.S. equity exposure, but at what cost? This market is expensive. The bottom chart shows retail funds have high cash, but we know from brokerage accounts that retail traders are in speculation mode.
U.S. Positioning Is High
18% of fund managers see a V shaped recovery. I see a strong recovery coming. Some investors are actually more bullish on the economy than them. However, it really doesn’t matter what they see if they are long. If anything, them being skeptical of the recovery, while very long signals their hands are shaky. They might sell if the news gets worse. 64% expect a U or W shaped recovery.
A U-shaped recovery is bullish, while a W shaped is bearish as it means another wave of COVID-19 will hurt the economy. Usually, I don’t expect double dip recessions. This time is different because the exogenous effect can come back.
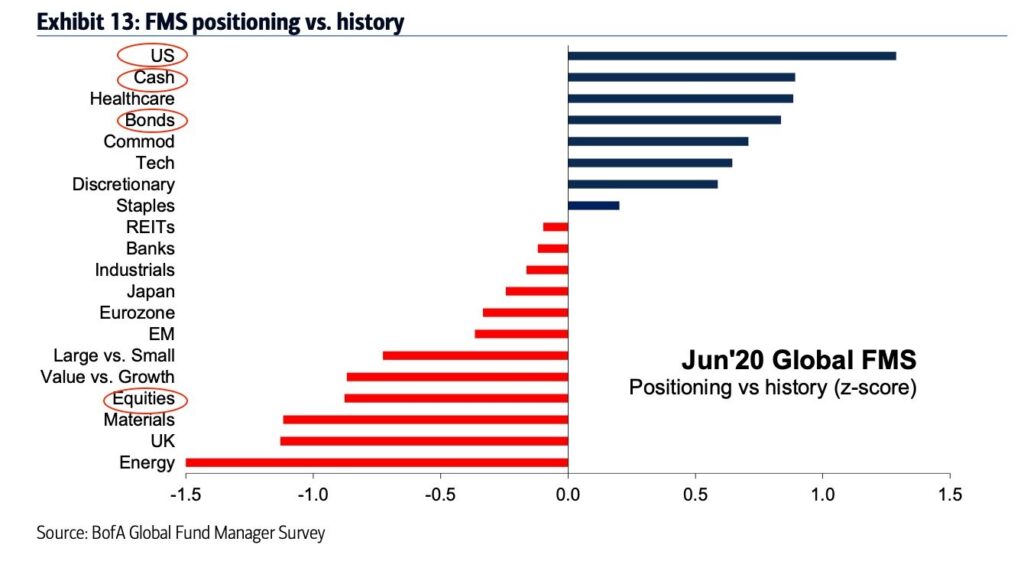
It’s critical to note that fund managers are very bullish on U.S. stocks, but they actually aren’t optimistic on global markets. As you can see from the chart below, the Z-score for the U.S. is about 1.5, but the Z-score for cash is 1 and the Z-score for equities is below -1. Managers don’t like emerging markets. Personally, I’m surprised that they aren’t more overweight tech given the explosion in cloud stocks.
Cloud speculation might be coming from retail. On Tuesday, the CLOUD ETF was up 1.58% as the index hit a new high by a penny. It’s up 11.76% since May 13th. This makes no sense to me. These cloud stocks did well because of the shutdown. They shouldn’t do well if the economy reopens. Certainly, they should correct, not accelerate higher. Speculation sometimes makes no sense.
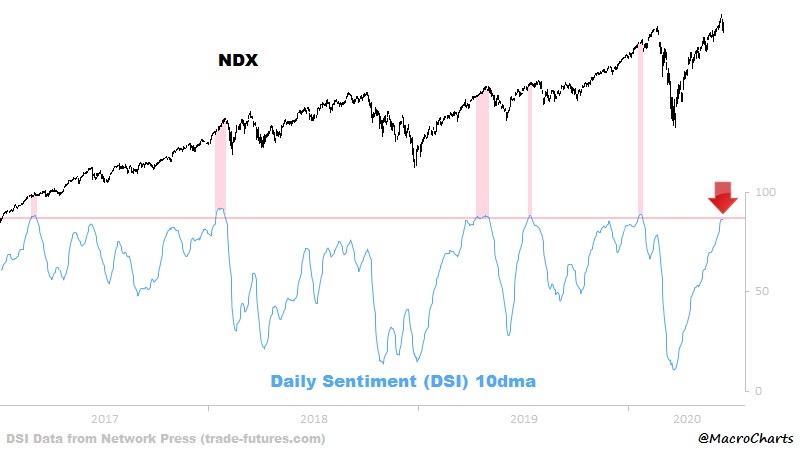
As you can see from the chart below, the Nasdaq 10 day daily sentiment index is at a level consistent with periods right before corrections in the past 4 years. The only period where it didn’t lead to a correction was in 2017 which was one of the most placid years ever. This data shows my point which is that the euphoria didn’t go away after the Thursday crash.
Conclusion
Normally, you’d expect speculation to go away after a 7% correction. However, the decline actually made investors more optimistic as they love to buy the dip. Eventually parabolic moves end badly. Stocks can’t keep up this pace. Corrections are supposed to make stocks more affordable.
If they are erased in a few days, it defeats their effectiveness. These few data points demonstrate why markets are due for a correction. It’s weird to say this because we just had one. However, if you talk to the bulls, they have only become more excited in the past few days.