Extreme Euphoria
Recently, it seemed like this had the potential to be a historic market where it gets extremely overbought like in January 2018. History has been made as the S&P 500 has increased 37.7% in the past 50 days, making this the best 50 day period ever. Previous best period was in 2009 when the market rose 34.2%. It makes sense that this rally was quicker because the recession was quick and due to an event that has been mitigated for the time being.
A difference between this rally and 2009 is that the market is now expensive, so it won’t continue the extreme momentum for much longer. Obviously, rallying 11 times in 14 days can’t continue. The market is up 10.74% in that period. Stocks might not even rally further at all for the rest of the year. Of course, it won’t be stagnant because so many events are coming in the next few months. Personally, I’m negative on the short term and not neutral on the medium term because stocks are up so much.
Most Indicators Are Neutral Or Bearish
Let’s look at the technical indicators to see if we are due for a pullback. Strongest bearish indicator is the put to call ratio which hit 0.4 which is a 5 year low. Put to call indicator is part of the CNN fear and greed index which rose 3 points to 61 which is greed. That’s a weak sell signal.
AAII investor sentiment survey only showed a modest increase in bearishness. This indicator still gives off a very modest buy signal. Percentage of bears fell 3.3 points to 38.9% which is 8.4% above normal. And percentage of bulls rose 1.5 points to 34.6% which is 3.4% below normal. This isn’t a strong reading either way. Normally, investors would completely ignore this data because it’s too close to average. However, the fact that it’s the only minor buy signal is fascinating.
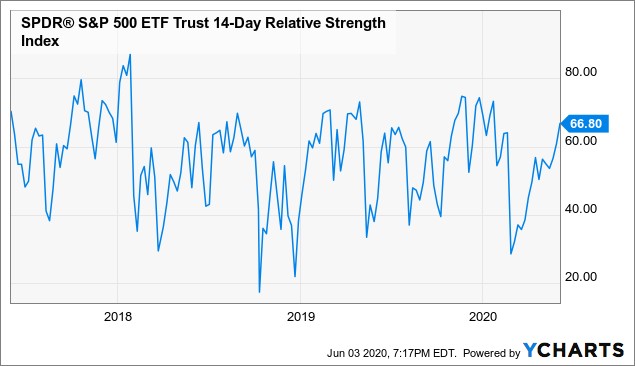
NAAIM investor positioning survey comes out tomorrow. It's exciting to see a reading above 90 which is a strong bearish signal. As you can see from the chart above, the 14 day RSI of the SPY ETF is 66.6 which is slightly below a sell signal. It’s amazing that we just had the strongest 50 day performance ever and few indicators are giving strong sell signals. Only the put to call ratio is that negative. I’m assuming the NAAIM index will be too.
Valuations
The stock market is so expensive that it's hard to see upside in the next 6 months even though the economy is set to rebound in the next few months. This is like if a kid at his birthday party eats the cake and opens the presents at the start of the party. At that point, there’s nothing to look forward to. Any reward has been had. The stock market priced in the entire recovery before the recession was officially over.
Let's assume the recession ended in June, but we don’t have data to back that up. We can just go by the trend of improvement which is what the market is doing. Of course, we are ignoring the national riots. This market apparently ignores all negative news.
The market has been so strong that the reasonable valuations of late March are completely gone. This is a very expensive market. It’s time to sell. As you can see from the chart below, the S&P 500’s forward earnings yield is about 4% which is the lowest in almost 20 years. It’s just about at the trough in the tech bubble. The stock market has everything backwards.
A bubble is supposed to be before the recession, not afterwards. People who just focus on the cyclical recovery will be destroyed if they ignore valuations. Valuations don’t help time the market, but since the market is overbought, this chart makes many more bearish.

Details Of The Intense Rally
The market was shot out of a cannon on Wednesday as if it hadn’t rallied in days even though this was its 4th straight gain. I don’t think the streak will last much longer. Philly Semiconductor index was up 2.87% which put it 2% below its record high. It has only been higher 6 other days.
Nasdaq 100 reached a new record high as it is up 44% from the bottom. This is the first index we’ve seen to reach a new record high. Obviously, the cloud index is at a record high, but that’s not a major one. It was up 0.54% and is up 11.59% from its February 19th peak.
S&P 500 was up 1.36% and the Nasdaq was up 0.78%. S&P 500 is now down only 3.34% year to date. Nasdaq is up 7.92%. This has been a better than average year so far for the Nasdaq which makes zero sense. People keep making arguments as to why the stock market should be up from the bottom. We know it should be up, but it has come too far with the last 10% rally.
This was about to be the best stretch of the Russell 2000’s recovery rally which makes no sense because the stock market was way cheaper in March than it is now. Even still, the rally off the bottom was 19.08% and the rally since May 13th has been 17.74%.
Retail traders who bought the airlines did very well. It is going too good for them as Spirit Airlines stock was up 19.46%. It’s up 116.1% since May 15th. What an amazing run!
Healthcare sector was the only one that was down as it fell 0.2%. 2 best sectors were the industrials and the financials which were up 3.91% and 3.83%. Industrials were led by Boeing which was up 12.95%. Boeing is up 44.3% since May 15th. This has been a hot stock with retail traders as well.