Consumer Improving? Maybe
Currently, the bottom of this cycle in Redbook same store sales growth was the lowest reading ever. It’s rarely negative. That makes sense because the consumer is usually growing and prices are usually increasing. In the week of May 30th, Redbook same store sales growth fell from -5.5% to -7.2%. That’s not in line with the recent rally in stocks. The market has increased 10 times in the past 13 days.
We would like to see more consistent growth if buying a market up that much that quickly. Many have been in the near term bear camp for a couple weeks. Bears became more entrenched as the market rallied in the face of the riots and the mediocre improvements in consumer spending growth.
Yearly growth in Chase card spending fell from -19.3% to -19.5% in the week of May 29th. That’s a disaster because it implies growth is staying in the recessionary range after exiting the depressionary range.
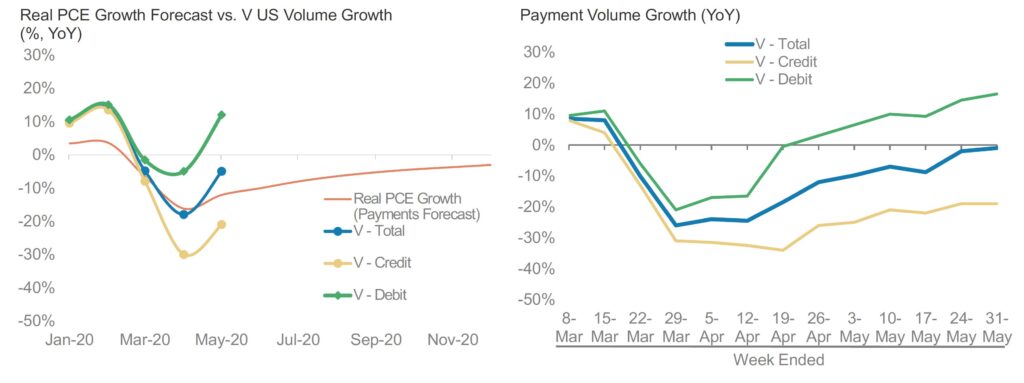
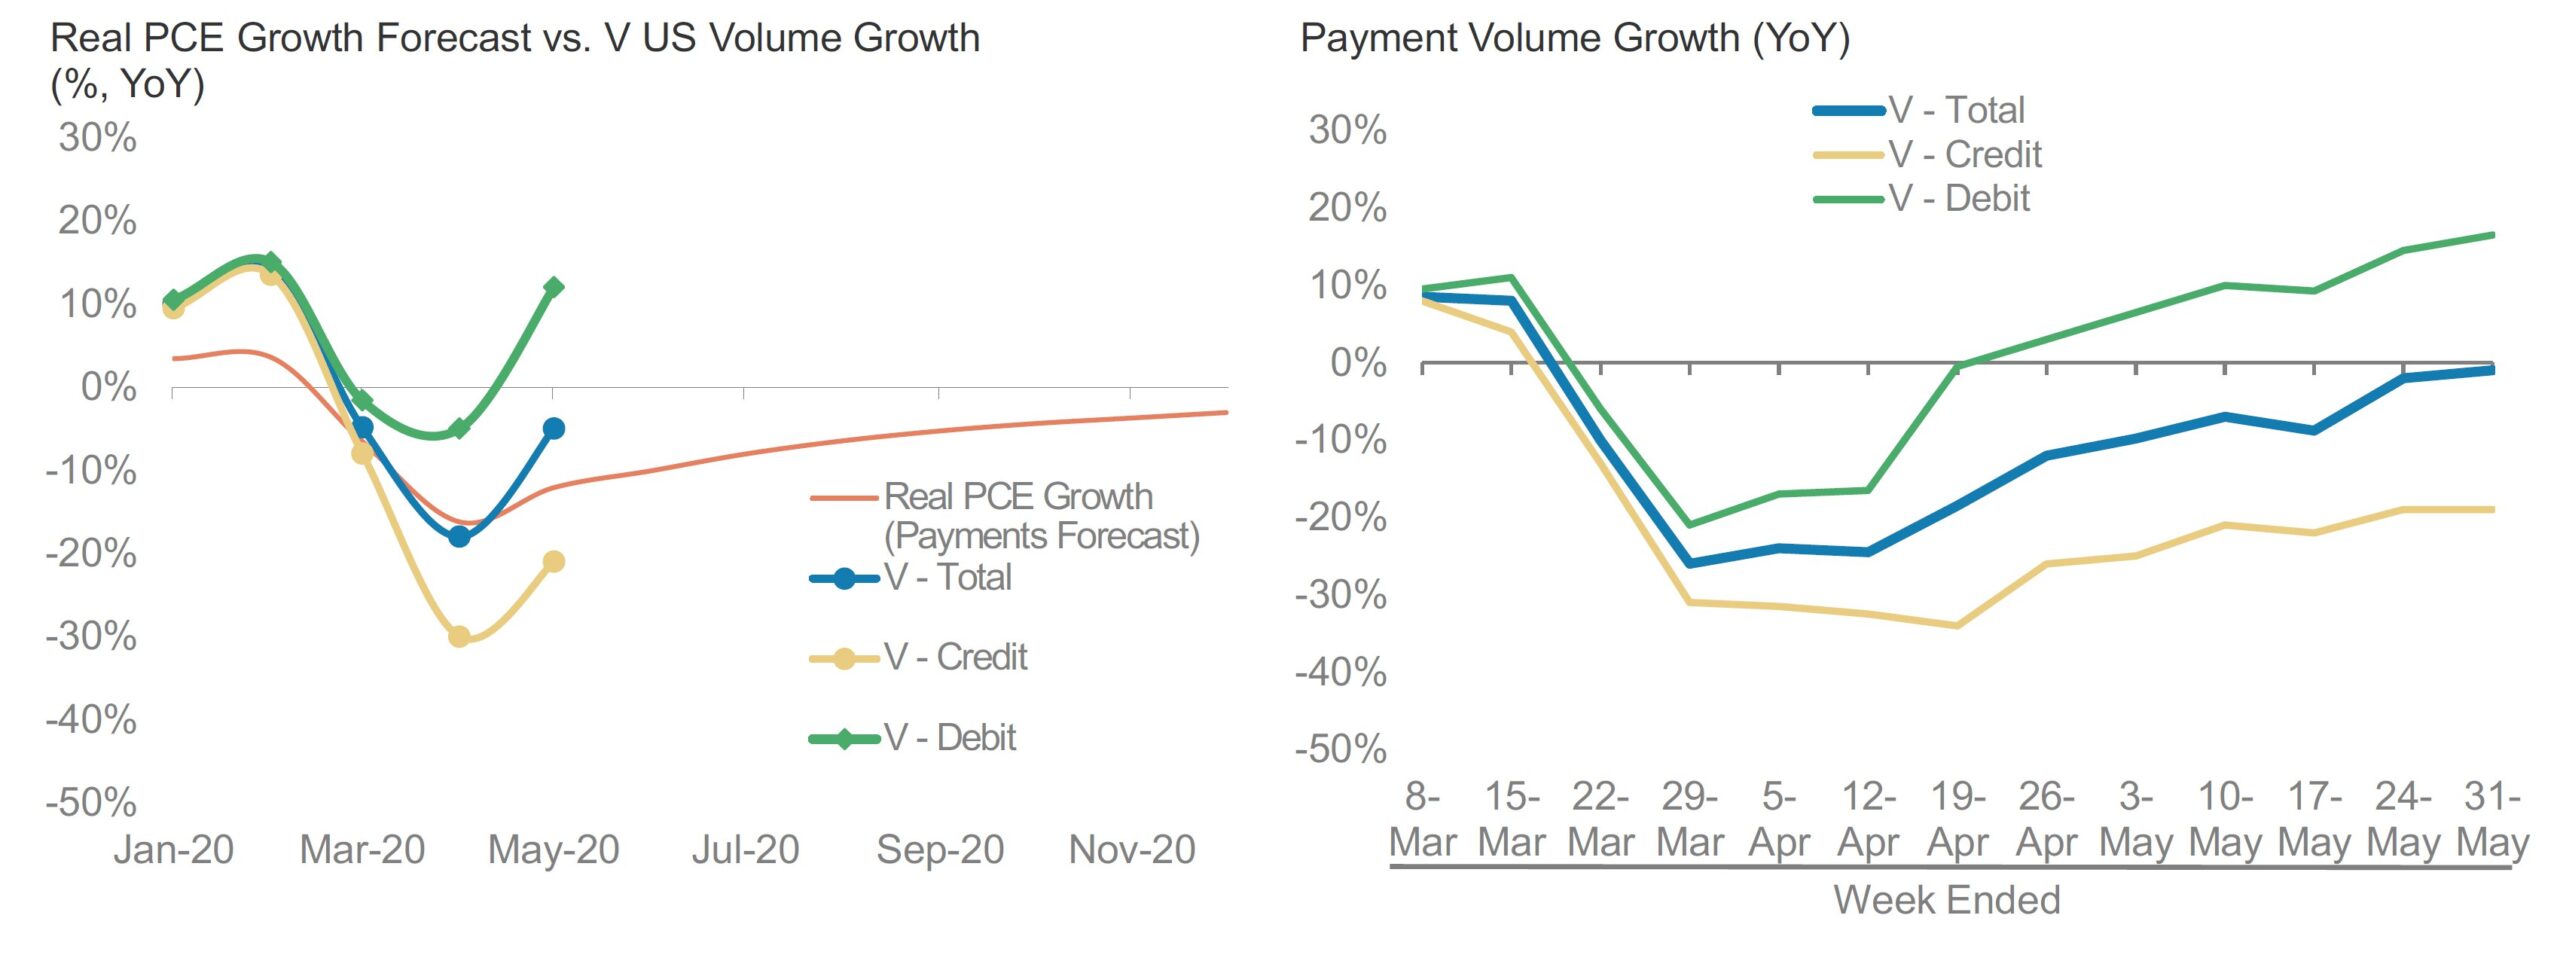
The charts above paint a better picture. As you can see from the chart on the left, in May U.S. total payment volumes only fell 5%. Debit volumes rose 12% and credit volumes fell 21%. As you can see on the right, in the last week of May volumes were only down 1% with debit volumes up 17% and credit volumes down 19%.
Improvement in volumes growth is much stronger than the real PCE growth forecast. This data makes it seem like the economy will be back to normal in July. That’s doubtful because federal unemployment benefits are going to expire in July and jobs haven’t returned. More the riots hurt the reopening efforts, the longer this recession will be.
Very Weak NY Fed Index
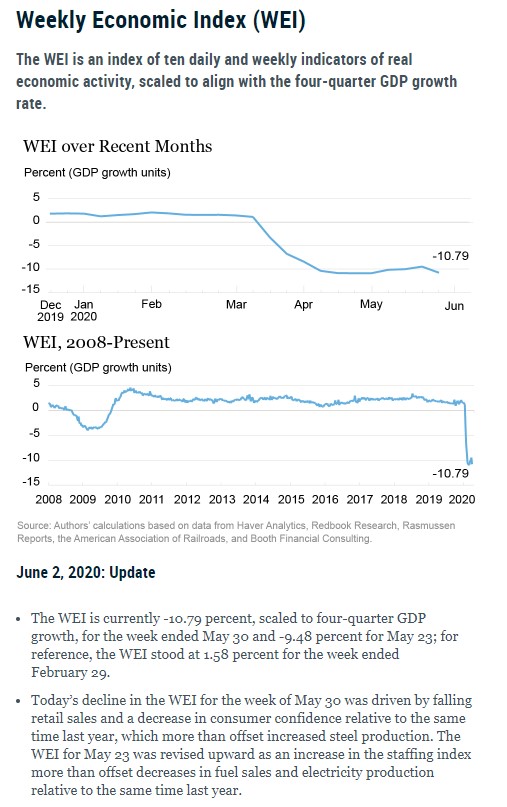
NY Fed’s weekly economic index fell from expecting a 4 quarter GDP growth rate of -9.48% to -10.79% in the last week of May. It’s based on 10 daily and weekly indicators of real activity. Good news is the prior week’s data was revised up because of an increase to the staffing index which helped growth more than the negative revision to fuel sales and electricity production.
Data from the week of May 30th showed lower growth because weak retail sales and consumer confidence compared to last year. That more than made up for the improvement in steel production.
Q2 GDP Growth Will Be Extremely Bad
Never would we have expected to see a -52.8% GDP growth reading in the Atlanta Fed Nowcast. Q2 growth will be higher than that, but it will definitely be in the negative double digits as the consensus calls for about -35% quarterly growth. In the update on June 1st, the estimate for real personal consumption expenditures growth.
And real private domestic investment growth fell from -56.5% and -61.5% to -58.1% and -62.6%. Those are impossibly bad numbers due to a terrible April. As shown with the Visa data, consumption got better in May. Nowcast is going to spike significantly, but the quarter will still be terrible.
Q2 NY Fed Nowcast in the week of May 29th fell to -35.53% from -30.47%. Never in a million years would we expect to see such a wide divergence of growth estimates. Normally, a 2% divergence is wide. This divergence is 17.3 points. That’s about 10 times a large reading. NY Fed index was hurt the most by the PCE report. It was also hurt by manufacturer and wholesaler inventories.
Next week the first estimate for Q3 comes out. It will likely be too negative. Ultimately, our uncertainty about the economy in the next 6 months has never been higher unless you compare it to 2 months ago when COVID-19 was expanding rapidly in America. St. Louis Fed Nowcast is much more in line with the Atlanta Fed Nowcast as it calls for -49.7% growth. It’s interesting because the NY Fed Nowcast is usually the negative one and the St. Louis Fed Nowcast is usually the optimistic one.
Now let’s look at the ECRI indexes. April lagging index fell from 236.9 to 232.5 which was a growth decline of 8.3% to 3.8%. April coincident index fell from 184.6 to 157 which meant growth fell from -2% to -27%. It’s clear the lagging index isn’t close to bottoming. However, the current index probably bottomed. It’s interesting to see how close these indexes become because the cycle was so abrupt to the downside.
Many think this will be one of the fastest recoveries ever, but the decline was so severe, it will take years to recover. As you can see from the chart below, the lost U.S. quarterly economic output won’t be recovered until 2029. Everyone is predicting a Nike swoosh recovery. It’s amazing how confident people are in this recovery. That’s the polar opposite of early April when people were still predicting a depression.

ECRI leading index sees a strong recovery, but that’s because it’s market based. Just because the stock market is experiencing euphoria doesn’t mean the economy will do well. In fact, if all the new retail traders lose money, they will be in worse shape than ever.
Specifically, the ECRI leading index rose from 122.7 to 125.7 in the week of May 22nd which was a growth improvement of 3.7 points to 25.1%. Growth was -35.8% at the start of May.
Conclusion
Some data shows consumer spending growth is stabilizing instead of accelerating and other data is more optimistic. NY Fed’s weekly economic index is still terrible along with all the forecasts for Q2 GDP growth. The economy might not recover its lost output until 2029, while the stock market has recovered most of its losses in a few months.
The stock market always prices in the future, but this rally has been unlike anything we have ever seen. We haven’t even gotten the May labor report, which will be the worst report ever, yet the stock market is already foreseeing a massive drop in the unemployment rate.