Earnings Growth Estimates Stop Falling
This article will be all about rate of change analysis. The stock market loves when the economy and earnings go from terrible to less bad. Since this was the worst recession in modern history, we are getting a lot of that.
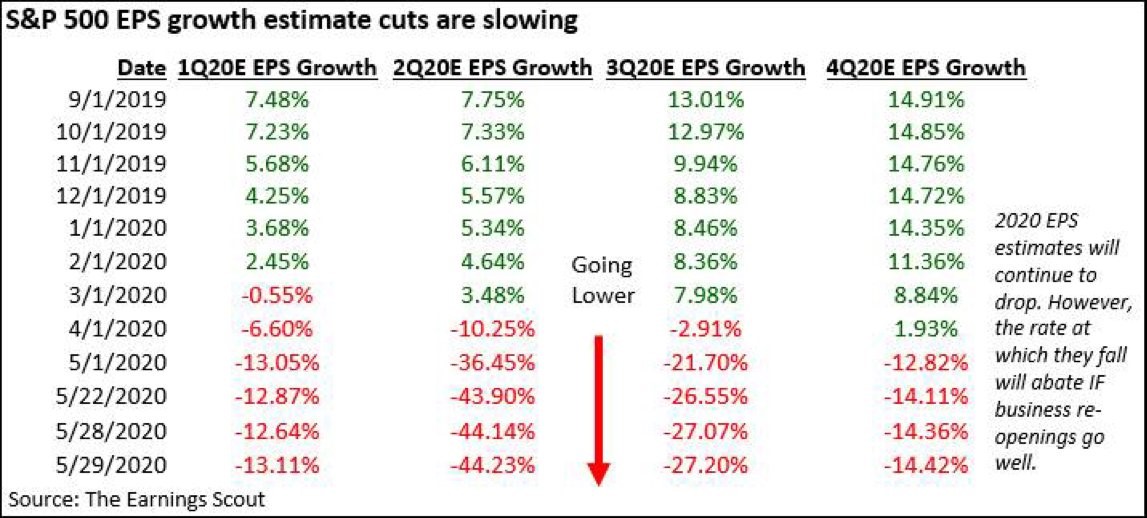
As you can see from the table below, Q2 EPS growth estimates have stopped falling precipitously. They hit almost rock bottom a week ago. Estimates fell from -43.9% growth to -44.23% growth. That’s hardly any change. S&P 500 will show a non-GAAP EPS profit. 93% of S&P 500 firms were profitable on a non-GAAP basis in Q1. 84% were profitable on a GAAP basis.
There will obviously be fewer companies reporting profits in Q2. But the situation isn’t as bad as it looked 2 months ago. There will silly top down estimates predicting losses. To be clear, the small caps will do much worse, but the large caps will report a non-GAAP profit.

The table also shows the improvement in growth anticipated in Q3 and Q4. This is the best case scenario for stocks as you have a slower decline in estimates and an expected improvement in growth. It explains why stocks aren’t correlated with earnings growth. They like when EPS growth goes from negative to a positive. When growth is in the double digits next year, it will be time to sell because the market will be much higher.
Let’s look briefly at how Q1 earnings season was now that it’s almost in the books. With 490 firms reporting results, we had a 12.61% decline in EPS with a positive surprise rate of only 0.38%. That’s dismal. Even in this recession, 64% of firms beat estimates. Just 30% missed them. Average sales growth was actually 1.4% which shows there was a huge decline in margins.
We are about to see margin expansion in 2021 which is why investors are buying stocks now. Average sales growth surprise was 1.47% and 57% of firms beat estimates. Worst sector for EPS and sales growth was energy which was the best sector since the bottom. The best sector was healthcare which has stalled out recently, but has had a great year.
Fewer Americans See A Depression
Most people think bad economic data should send stocks lower. People even go as far to say stocks and the economy aren’t related. They are related. It’s just that stocks don’t trade on past economic data. As you can see from the chart below, in the 3rd week of May, consumers in a Gallup survey stated 71% think the economy is slowing down, in a recession, or in a depression. That’s down 3 points from the prior week which means the economy is improving.
Judging by the streak of jobless claims falling, it’s likely that this data point will only improve from here. It’s likely that the percentage saying the economy is in a depression fell quicker than this. This is becoming more like a recession than a depression as the shutdowns end.

Jobless Claims Fall Again
Jobless claims have been falling. Initial claims fell for the 8th straight time in the week of May 23rd. That is a record long streak. You can argue this has been the easiest recovery to game because of its consistency on that front. Initial claims fell from 2.446 million to 2.123 million. Even though claims were slightly above estimates for 2.1 million, this was a much better report because there was a 13% decline which was better than the 9% decline last week. There were 1.2 million PUAs which are claims filed by self-employed people.
Remember, self-employed people can get unemployment benefits in this recession. That was offered because there are so many independent contractors working for gig economy firms such as Uber and Postmates. As you can see from the chart below, when you add in PUAs, claims increased last week, but fell this week.

The End Of The Recession
The stock market is acting like the recession is over. We just got our first data point that the recession is near its end. Continuing claims fell from 24.9 million to 21.1 million. When continuing claims fall, it means the recession is over or near its end. It's surprising that a decline occurred so fast. We need to wait for 2 more readings to confirm the decline is real, but the stock market is certainly leaning in the positive direction. Yes, momentum is off the charts, but stocks are rallying for a reason.
Unadjusted continued claims fell 3.7 million to 19.1 million. It’s not the adjustment that is causing the decline in continued claims. Most of the decline came because of Florida and California. They represented 82% of the decline as claims fell 76% in Florida and 40% in California. Florida is 50% back open which means people need to go back to work. They can’t stay home and collect benefits if firms offer them their jobs back.
And they need to go to work. Washington also had a 40% decline. After that, the next biggest drop was 16%. On an unadjusted basis, without Florida and California, the drop in continued claims was 3.9% instead of 15.5%. That’s still a decline though which is a positive.
Conclusion
Data is going from terrible, to bad which is the best possible sign for stocks. We are seeing EPS growth estimates falling at a much slower pace. EPS growth is about to increase in the 2nd half. Fewer consumers think the economy is in a depression.
Finally, initial claims have been falling for a record long 8 weeks and continued claims fell for the first time in this recession. Historically, when continued claims start falling, it means the recession is almost over. We’ll wait 2 more weeks at least to determine if the recession is over. It could come back if there is a 2nd wave of COVID-19 in the fall.