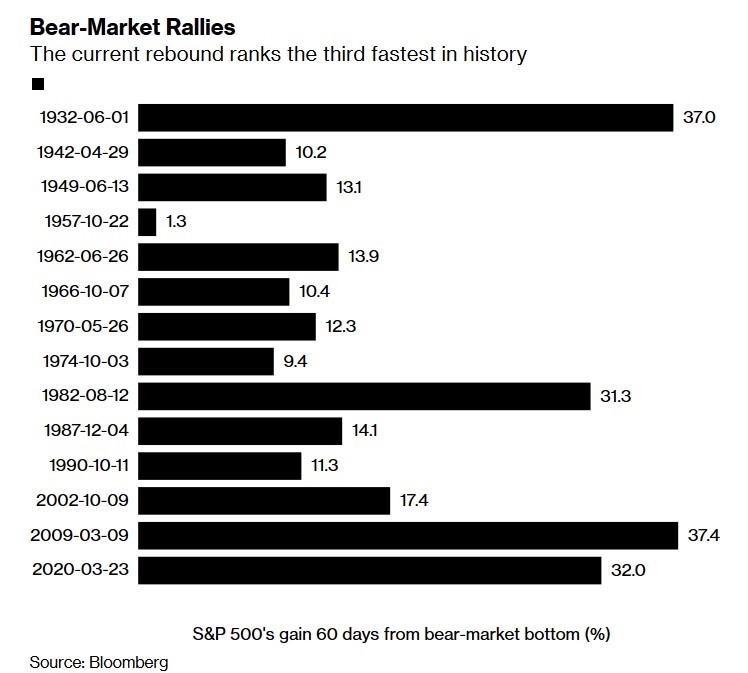
3rd Best Bear Market Rally Ever
As you can see from the chart below, this has been the 3rd largest bear market rally ever. Of course, you can argue this, among others, is the start of a bull market. However, we don’t know for sure if this is a new bull market and we didn’t know if any of the previous rallies were bull markets at the time.
We can look at this rally in comparison to the 2009 rally because it was the strongest, had similar, albeit less, central bank intervention. It’s amazing that the 2nd most recent powerful bull rally was 18 years ago. Most traders, like me, didn’t experience the rolling dreadful bear market of the early 2000s. If they did, they wouldn’t be all in on tech.
Big Time Stimulus
It's difficult to see how this current rally is similar to the one in 2009. By March 2009, the banking crisis had been mostly resolved. The recession ended up ending in June which was 3 months later. On the other hand, in this cycle the stock market bottomed a day after the New York shutdown started. This rally has been quick because this is an exogenous event and because of all the fiscal and monetary stimulus.
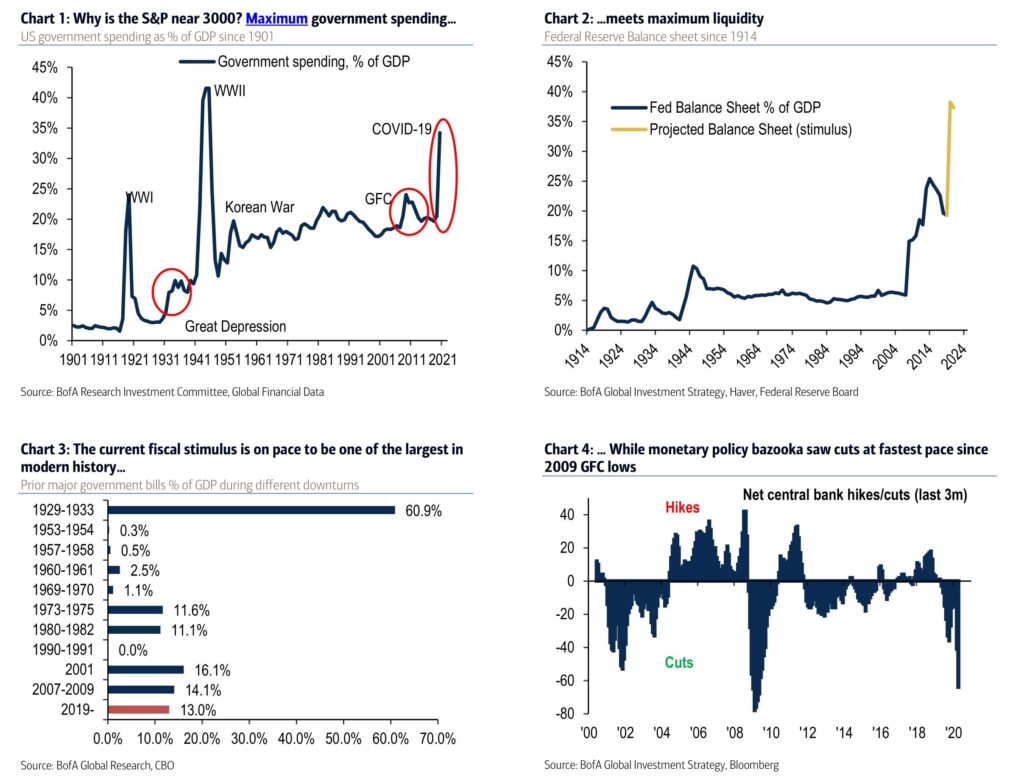
As you can see from the charts below, government spending as a percentage of GDP has exploded along with the Fed’s balance sheet as a percentage of GDP. Current fiscal stimulus is on pace to be one of the largest on record. Net number of central banks cutting rates in the last 3 months is nearly as low as the trough of the last crisis. That being said, this recession likely won’t end in June like the last one. We can use the same timeline because both bear market rallies started in March (this one was 2 weeks later).
The market was priced based on uncertainty during the decline. Once the number of cases in Italy started falling, the stock market stopped crashing. That’s fair, but the latest rally acts as if certainty is here even though we don’t know how bad the 2nd wave will be or how the economy will recover. We also have uncertainty over the presidential election and relations with China.
Not A Bear Market?
Some people are actually saying that this current bear market isn’t really a bear market if stocks reach a new high soon. That's disturbing because that’s the type of chatter you hear when stocks are about to swoon further. To be fair, by definition that chatter could be correct if the stock market reaches a new high this summer. That makes it a crash with a quick recovery, not a true bear market.
However, the fact that historians are just assuming the market will hit a new high this summer is scary. When people make a prediction, while acting like it’s not a prediction (they think it’s inevitable), they end up with egg on their face often. Nothing is inevitable in markets. It’s not even inevitable that the S&P 500 will be higher than it is now 15 years in the future.
Put To Call Ratio Worrisome
Not all indicators are signaling a pullback is coming. CNN fear and greed index and the NAAIM exposure index are both at neutral. AAII investor sentiment survey shows more bears than bulls. It’s not as strong of a signal to buy stocks as it was the prior week, but it’s not anywhere near giving off a sell signal. With that being said, a correction of at least 5% is likely coming in the near future.
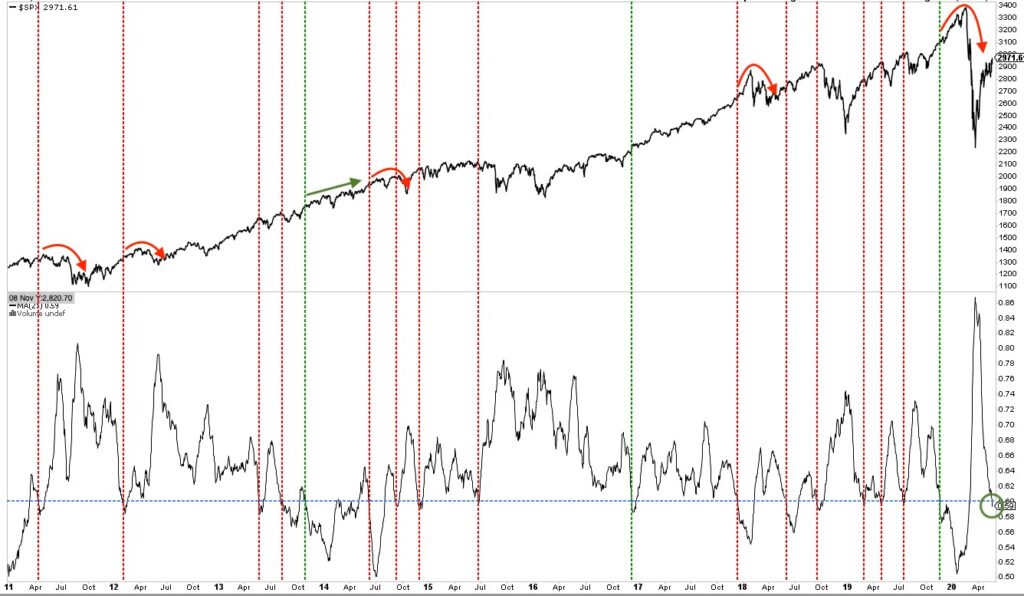
As you can see from the chart below, the put to call ratio is low which signals stocks are overbought. Whenever this threshold is reached, either stocks pull back or they rally and then fall below the price they were at when it was hit. It’s surprising that investors have gotten this enthusiastic during a pandemic. That’s probably because emotions swing like a pendulum. S&P 500 will likely not hit a new low, but even the optimism is concerning.
Another Sell Signal
The chart below shows another sell signal. This confirms my prior opinion. Obviously, it’s dangerous to only look at data that supports your opinion, but that doesn’t make this objective data less useful. It’s just a chart. You can choose to ignore it or follow it. As you can see, the S&P 500 ETF’s volume has crashed. It is 64% below its 3 month average. In the past 20 years, whenever volume fell this much, while the index was above its 200 day moving average, the S&P 500 always corrected in the next 2 months. Sometimes it fell sharply.
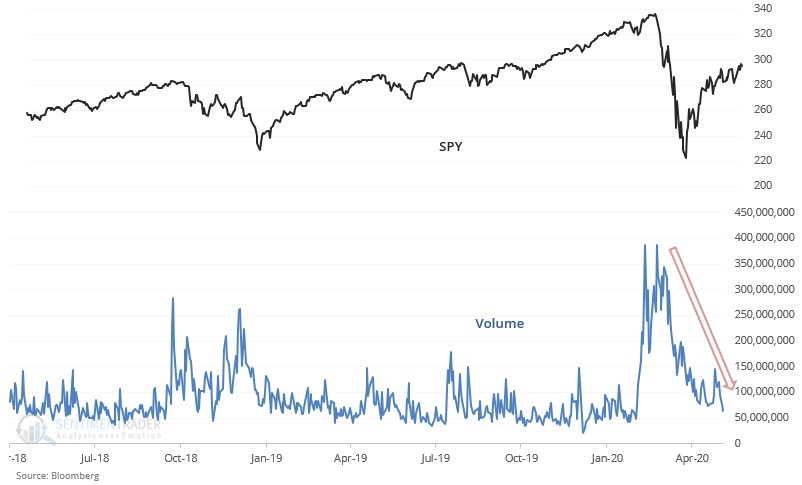
Follow up research to do is to see how much the S&P 500 is below its 200 day moving average because it would make the signal look less strong if it was just a tick below that indicator. In fact, we are only slightly below that threshold. 200 day moving average is about 3,000 and the market is at 2,955.
Let's review what happened at the 2009 bear market rally. After the S&P 500 surpassed the 200 day moving average in June 2009, it fell 7%. Therefore, even if it breaks that level, it’s not smooth sailing. It’s also notable that the market fell 7% in the month the recession ended. This tells us even though the economy is recovering, it doesn’t mean the stock market will rise in a straight line.
There is dramatically more uncertainty in May 2020 than there was in June 2009. When you add in the fact that valuations are stretched, it’s only natural to expect stocks to fall.
Cloud stocks remind us of the fertilizer and energy stocks in 2007 and 2008. This market is a combination of the pre-cash and post-crash markets of last cycle, when considering October 2008 to be last cycle’s crash.