Did The Weekend Matter?
It was wrong to say there would be a sharp decline coming on Friday as the market was up slightly and the small caps outperformed again. It was the day before Memorial Day weekend. Investors didn’t think as many people would go on vacation as normal because the economy is still partially shutdown. Turns out, it was like a normal Friday before a holiday. There weren’t big moves in stocks and it ended slightly positively.
Personally, I’m still negative in the near term as reality will come back on Tuesday. Some conspiracy theorists think there is someone pushing stocks higher to make people feel good into the weekend. It's more likely there were fewer players. Everyone will be back on Tuesday meaning there could be a decent sized decline.
There Was A Retest?
Obviously, we know the market never retested the bottom on March 23rd. At the time that a retest wasn’t guaranteed like the media claimed it was. If everyone is saying there will be a retest just because they want to buy more stocks, it doesn’t make sense for there to be one.
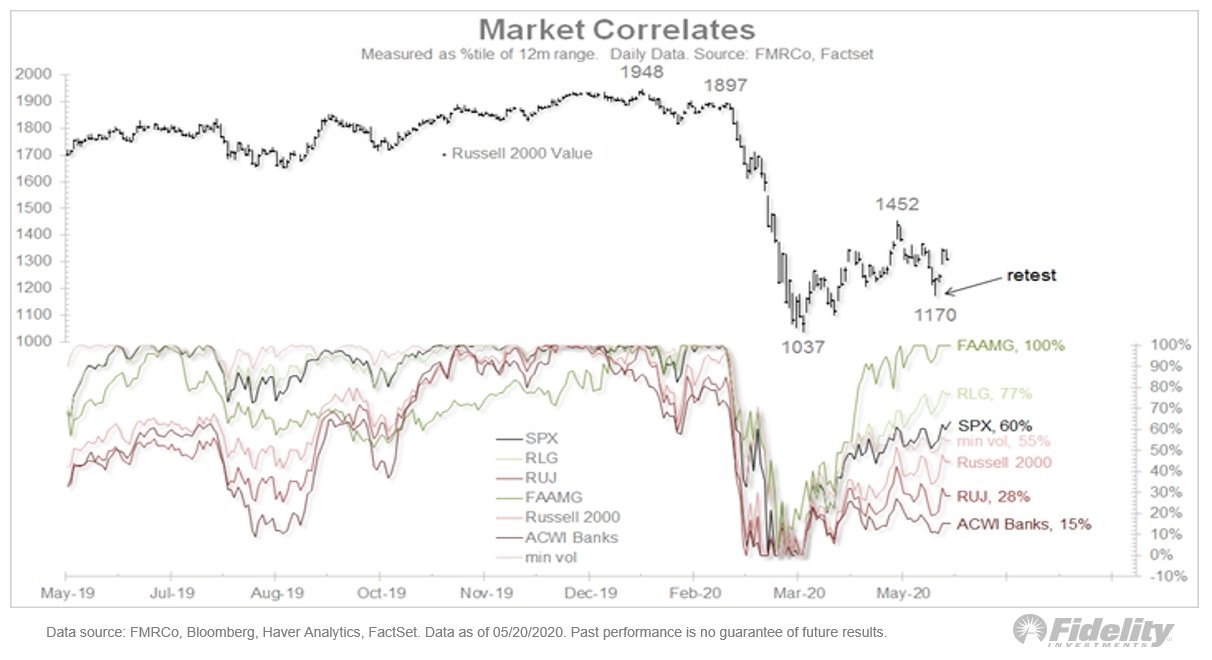
Big tech stocks weren’t likely to fall again after the March bottom since they are outperforming in the new world we are living in. Even though they will likely fall, many are not negative enough to suggest they will make new lows. We're talking a 20%-40% decline for the high flyers and a 10%-15% decline for the big firms like Microsoft and Amazon. The chart below suggests there was a retest in parts of the market. It occurred in the Russell 2000 value index. That’s because the small cap energy and bank stocks did poorly.

You can see in the bottom part of the chart, the all country world index for the banks has underperformed. Many won't invest in banks unless there’s a new type of bank that comes about. These aren’t growth stocks and they carry risk. There is medium risk and low reward. That’s a bad trade. It's better to invest in companies with competitive advantages. Major banks won’t ever be usurped, but that doesn’t mean they don’t carry risk. They have default risk. Personally, I own a credit card stock because I don’t like default risk.
TD Ameritrade Shares Data On Retail Traders
We have reached the peak of retail trade domination. Some are beginning to mention that retail traders did better than the pros by buying the dip. Firstly, that’s correct. Retail traders were right to buy the dip, while the pros were scared. However, sentiment has changed which is why people are nervous.
For the past few years, everyone made fun of retail traders for being dumb money. Retail traders on Robinhood tend to buy anything that falls which is a bad idea. People giving props to a group they despise shows sentiment is too extreme. It’s like how if an ardent bear turns bullish, it’s a bad sign.
By the way, the AAII investor sentiment survey showed the percentage of bulls rose 5.7 points to 29% which is still 9% below the average. Percentage of bears fell 5.6% to 45% which is 14.5% above average. This is no longer a bullish contrarian signal. But it’s not close to the exuberance we are seeing from other data points on retail trading.
On May 20th, the NAAIM exposure index was up from 57.71 to 63.22 which is below the spike on April 29th which was 78.55. This is neither a bullish nor bearish indicator. CNN fear and greed index is at 50 which is neutral.
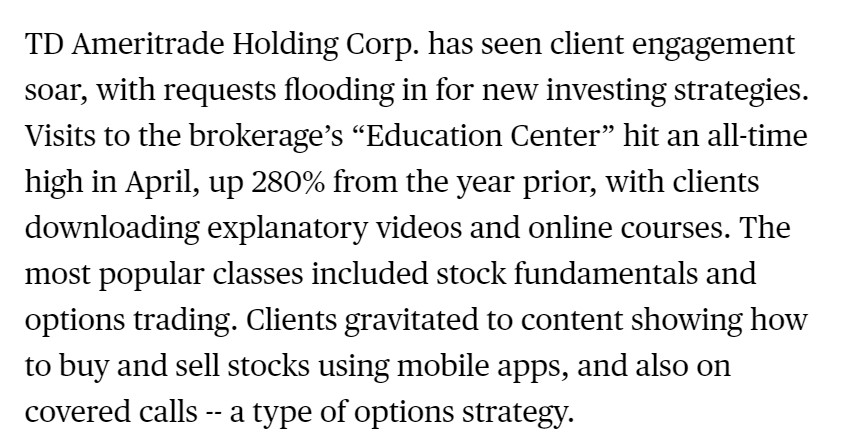
As you can see from the screengrab above, there was a record high in client engagement with TD Ameritrade’s Education Center. There was a 280% increase in retail traders viewing these videos and online courses which explain stock fundamentals and options trading. There has been an increase in betting on stocks because betting on sports is gone. Many wonder what happens to stocks when sports come back in July.
Another aspect worth following is the explosion of investing in cloud stocks. There was a big moment in this trade on Friday. Bloomberg Terminal actually reported on a tweet sent out by an investor on Twitter named Puru who owns a portfolio of almost exclusively tech stocks. He has been investing for 4 years the same way. Fact that he is getting so much notoriety is a sign this tech bubble is near its end.
Similar To 2009?
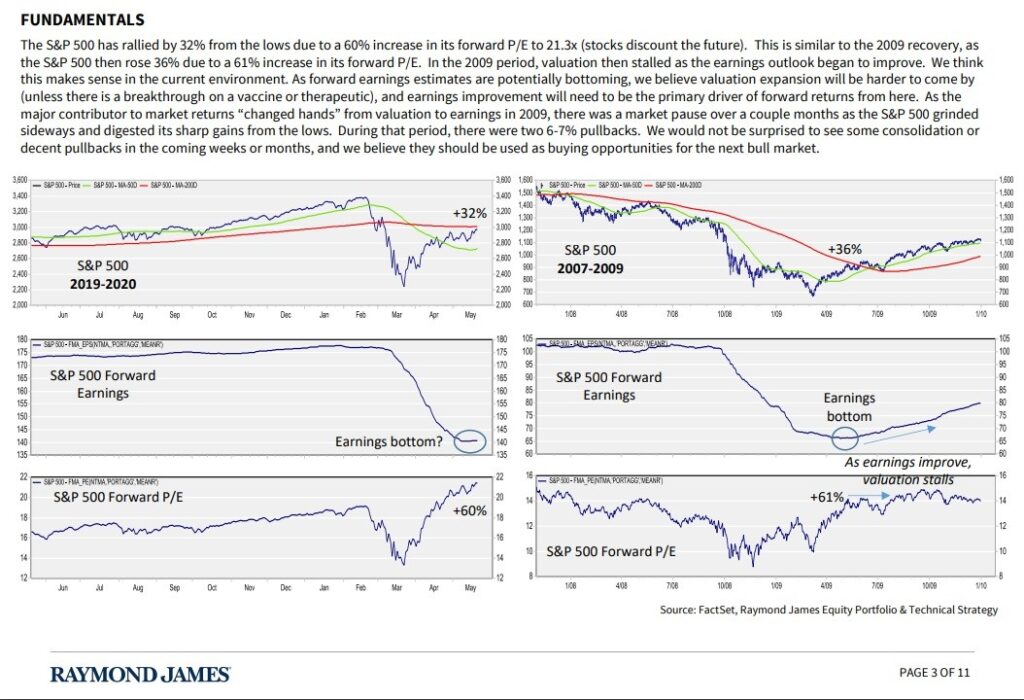
Raymond James put together 3 sets of charts showing us how the recent bottom is similar to the one in 2009. Of course, they are doing this after stocks have already bottomed and most of the quick gains have occurred. It's likely that in March there were charts showing how the stock market could fall 40%.
As you can see, the charts show the recent S&P 500 increase of 32% has led to a 60% increase in the forward PE multiple which is now 21.3. That’s similar to the last bear market where the market rose 36% and the forward PE multiple rose 61%. This initial rally in stocks was about multiple expansion.
They think stocks will stay in a sideways patter for a few weeks until earnings estimates take charge and drive the market higher. They are late in calling for sideways action. We have already seen a sideways market with some corrections for the past 6 weeks.
Conclusion
Investors were expecting a decline on Friday. But because it was the day before a long weekend, the action was boring as we saw modest gains. Many don’t think the market is off the hook. We can likely expect big declines next week. We could see another 5% correction. It’s concerning how many retail investors are piling into stocks. On the other hand, it’s good to see EPS estimates bottoming.