Smart Versus Dumb Money
If you’ve been trading for a significant period, you may have noticed that short theses sound smarter than long ones. Long investors tend to believe management teams, while short sellers do investigative work. Shorts come up with reasons why management is wrong, which makes their argument look smarter.
However, that doesn’t make it correct. If the shorts are proven wrong, there must have been answers to their concerns. Manysee this situation as similar to the current market.
We have the bulls claiming stocks should move higher because the economy is reopening and getting back to normal. Some bulls are just following the momentum. Bears think stocks are too expensive and there is the risk of a 2nd wave of COVID-19.
An argument has been that stocks look more expensive because high multiple stocks like tech stocks have an increased share of the index. Energy and banks have a lower share which raises the average multiple because they typically have low multiples. Energy stocks aren’t secular growers which makes them less valuable than technology stocks.
However, at cyclical bottoms, they are big winners. Some are bullish on energy because the short thesis that frackers have too much debt and don’t generate an economic profit has played itself out. Weaker players are gone and the stronger players are cutting costs.
Extreme Retail Trading Action
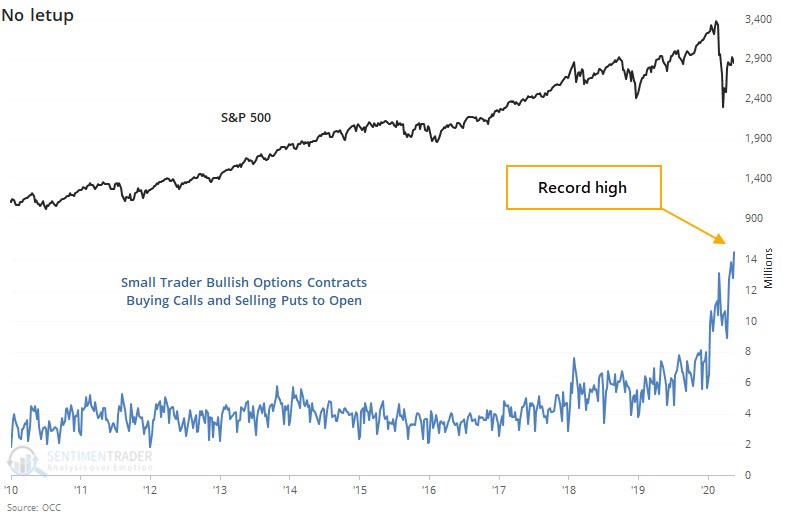
Charts showing extreme retail trading action keep coming. Least sophisticated retail traders are optimistic while the most experienced investors are more cautious. As you can see from the chart below, the small trader bullish options contracts are at a record high. That’s buying calls and selling puts to open.
Cction that some called the sign of a bubble only increased during this bear market. Personally, I will continue to avoid the names that retail traders crowd into. But I don’t want to sell stocks because of the Dave Portnoy effect. He’s the founder of Barstool sports who has gone from commenting on sports to trading stocks. Many refuse to be negative just because people who don’t know much about investing are getting involved. We will simply avoid the overheated cloud stocks besides the investments I made before the run started.
Sentiment Indicators Contradict Each Other
Smart traders shouldn’t always be followed. They were extremely negative in the March Bank of America fund manager survey. To be fair, the surveys and 13F filings could have differed from actual opinions because markets moved quickly. Even I used the negative Bank of America survey as fodder to go long stocks. CNN fear and greed index is currently at 39 which is fear.
Many traders are saying the market is overbought. That’s partially because many missed the low. AAII sentiment survey showed more than half of investors were bears in 6 out of 10 weeks which is a contrarian positive signal.
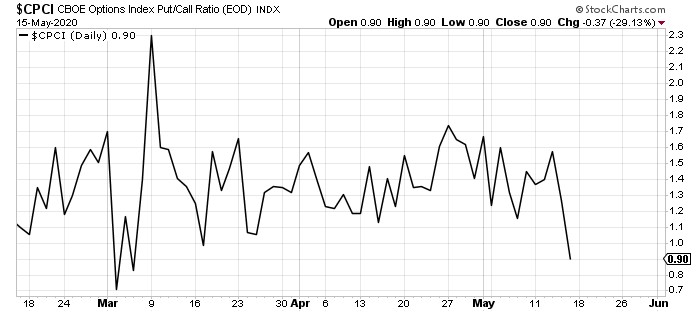
As you can see from the chart below, the put to call ratio has been cratering which is a contrarian negative signal. It goes along with the retail trading data as it signals there is euphoria. Euphoria shown in the put to call ratio in early March led to a sharp decline.
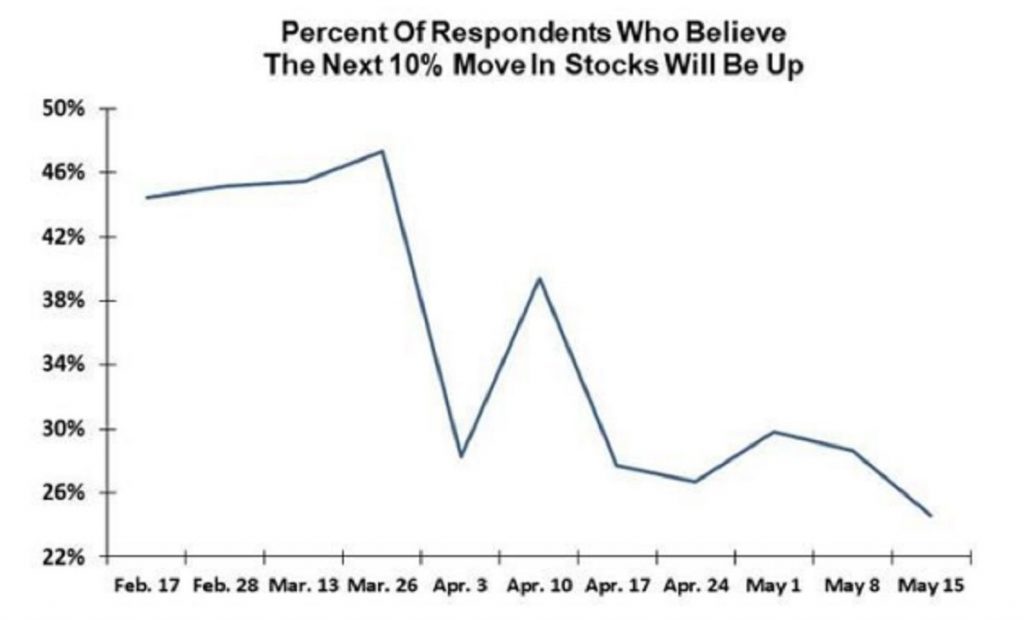
Indicators are all over the map. Evercore did a survey where it asked clients whether they think the next 10% move in stocks will be higher or lower. These questions are always confusing because they have an indefinite time horizon. In theory, the stock market could rise or fall 10% in 2 weeks. It could also take 2 years before it rises or falls 10%.
Next 10% move is up because Many don’t see that large of a correction occurring within the next few months. Obviously, if the market rises 4% in the next month and then falls 10%, that wouldn’t qualify as a 10% move down from current prices.
As you can see from the chart below, only about 25% of clients see the next 10% move being up. We can understand their rational. They think the market is up too much too quickly and can’t see a 10% rally without a big correction. Plus, a 2nd wave could easily send stocks down even further.
This survey was from May 11th to the 13th and had 560 respondents. It’s amazing that investors are more negative now than they were at the bottom. This is a bullish contrarian signal.
Sector Madness
Everyone knows technology has done really well. Personally, I’m not in the bull or bear camp. In the short term, I’m bearish on the cloud stocks, but as a whole I’m neutral on tech. And I don’t think this is part 2 of the tech bubble because these firms have big earnings now. However, wouldn’t go overweight them because of regulatory risk and because the trade is crowded. Technology, healthcare, and consumer staples will likely always be my favorite sectors for the long run.
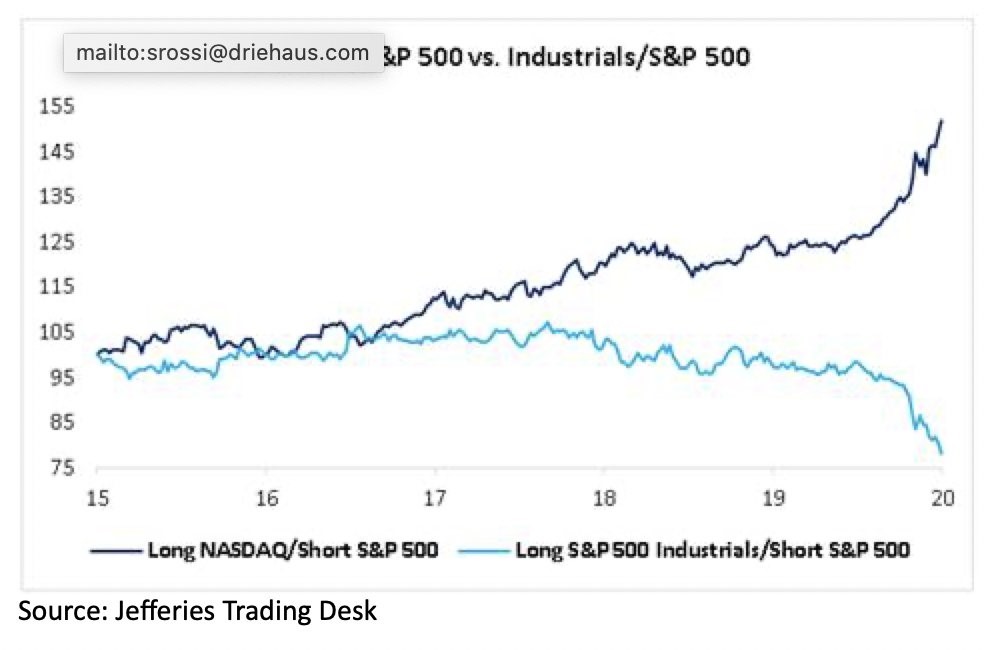
Extreme movements in the sectors can be seen in the chart below. Long S&P 500 industrials and short S&P 500 trade has been a complete disaster. Boeing has played a large part in this decline. Since I’m relatively bullish on Boeing and I see a cyclical upswing coming, I think this trend will reverse.
Long Nasdaq short S&P 500 trade has worked marvelously. Obviously, it’s scary that seemingly everyone owns Amazon and parabolic trends don’t end well. However, Amazon is a well-positioned company because of AWS and advertising. If the stock fell 15% because it went out of favor, many will be bullish.
Conclusion
There are conflicting data points on whether investors are bullish or bearish. Keep in mind, the media is always backwards looking. Now they are saying the market could be range bound. That’s just a summary of the past month. Stocks are ready to rally over the next few months with cloud stocks underperforming.
Remember, investors aren’t pricing in a return to normalcy. Retail and energy will do better than the cloud stocks over the next 3 months.