After last week’s Redbook same store sales growth report, many predicted that would be the bottom in sales growth. Mostly because growth was relatively low and because the economy is starting to reopen. So far, that prediction looks good. In the week of May 9th, yearly growth rose from -9.3% to -7.5%. Longer that bottom holds, the more likely that is to be right.
However, this entire exercise might be mostly useless because everyone knows the economy will improve in May. Question is how much it will improve by and if COVID-19 comes back in the fall/winter. If retail stores and restaurants can only open at limited capacity, this will be an elongated slowdown. Many businesses would rather stay closed than open up at limited capacity.
When they are closed, they can limit costs. Why reopen, if it’s a money losing venture? Very few firms would exist if this was the upside. The stock market is ignoring the potential for a weak recovery. That’s why seemingly good news on the recovery in May and June could be met with selling.
Buy the rumor sell the news. It’s easy when you look at the April data because everyone knows it’s going to be bad. It gets more complicated in May and June because expectations are higher. There will be different interpretations of the recovery.
Deflation is Here
We always knew deflation was coming because oil hit negative prices. Clearly, you don’t need negative oil prices for deflation. You only need a decline in prices. Specifically, headline monthly CPI was -0.8% and yearly CPI was 0.3%. Yearly CPI was expected to be 0.2% higher and monthly CPI was right on target.
Core CPI was -0.4% monthly and 1.4% yearly. Core inflation hardly moves, so this decline was a big deal. This was the biggest monthly decline in core CPI ever. The previous record was 0.3%. On a yearly basis, core CPI was the lowest since April 2011. The lowest core CPI ever was 0.6% in October.
Within the headline report, food prices were up 3.5% (highest since February 2012) and energy prices were down 17.7%. Energy commodities fell 31.4% which was driven by the 33.2% decline in fuel oil prices and the 32% decline in gas prices. Food away from home CPI was 2.8% which was below food at home CPI.
Previously, we had seen food away from home inflation higher because the labor market was tight. Waiters and cooks needed higher wages which drove up the price of eating out.
This situation has changed as there is less need for many restaurant jobs now that they are only doing takeout and delivery. Full service meals and snacks inflation was only 2.4%. As you can see from the chart below, food at home inflation was 4.1%. There was hoarding and a general increase in demand because people are eating at home more.
Food at home inflation was the highest since February 2012. Within the segment, fruits and vegetables was the only one with low price growth as it was 0.4%. Highest inflation was meats, poultry, fish, and eggs which had price growth of 6.8%.

Core commodities inflation was -0.9% and core services inflation was 2.2%. Commodities inflation had been low before this recession. A decline in core services inflation drove the overall rate lower. That’s the lowest core services inflation since February 2014. This is only the lowest core commodities inflation since November 2017. Core commodities inflation has been negative for most of this expansion. Apparel had the lowest inflation as prices fell 5.7%. Demand fell sharply as people didn’t need to buy clothes since they weren’t going out.
Furthermore, there was probably more discounting in relation to the JCPenney bankruptcy. Used car and truck prices fell 0.7% and new car prices fell 0.6%. Discounting didn’t help the putrid demand for autos. As usual, tobacco and smoking products had the highest inflation as their prices were up 4.9%.
Shelter inflation catalyzed the major decline in core services inflation as it fell from 3% to 2.6% which is the lowest rate since February 2014. It’s quite an unusual situation because you can argue the price of rent doesn’t matter if people aren’t paying anything. This is the only situation where people aren’t paying rent and aren’t facing consequences.
Transportation services had been driving inflation lower. That drag increased as its inflation was -5.5%. We saw in Lyft and Uber’s reports, demand for ride sharing was down huge.
Medical care services inflation, which had been a major problem before this recession, increased from 5.5% to 5.8% which is the highest rate since December 2007. This is the 4th highest reading in the past 20 years. Highest was 5.9%.
We will be in uncharted water if inflation increases in May. That comp will be 0.5% higher which means we would need a very big price increase to get it to the highest inflation in over 20 years.
No Record Unemployment Rate
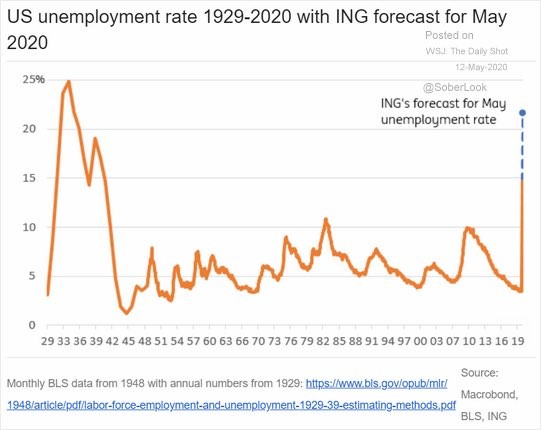
This is the survey week for the May BLS report. Jobless claims report this Thursday will give us a good idea about how many jobs will be lost in May. Many are wondering if the unemployment rate will be higher than the peak in the Great Depression. The chart below shows ING is predicting the unemployment rate to rise the low 20s in May which would be a few points below the record.
It’s possible that the May report is the peak in the unemployment rate for the cycle because people will be getting their jobs back as the economy reopens. At the very least, the increase in the unemployment rate in June will be much smaller than the increase in May. That’s just like how the May increase will be much smaller than the April increase.
Originally, I predicted the unemployment rate to reach a record this year. Beut with all the people leaving the labor market, it might not happen. Once the unemployment rate peaks, we will be in the sweet spot for stocks as they love a high, but falling unemployment rate.