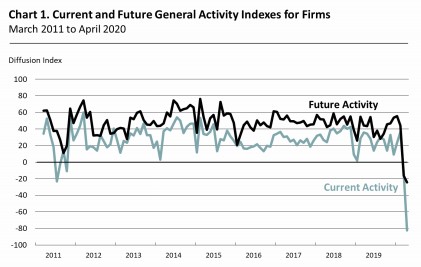
Philly Fed Index Hits A Record Low
On the one hand, the Philly Fed non-manufacturing index hitting a record low isn’t a huge deal because it was only started in 2011. On the other hand, it would probably be at a record low even if the data went back several decades. It is becoming clearer that the economy is in the worst recession since the Great Depression. This is a diffusion index which means it can’t get worse than -100.
April reading of the question that asks about business activity in the Philly region showed 98.2% saw a decrease and 1.8% saw an increase. It can’t get much worse than that! It’s very likely this reading would have been much higher in 2008 and 2009. Diffusion index for that question fell from -35.1 to -96.4.
A question which asks businesses about their own firm was slightly more positive. As you can see from the chart below, the current diffusion index on their own firm fell from -12.8 to -82.5. Only 2.9% of businesses saw an increase in activity.
Breakdown of this report is terrible as you’d expect. New orders index fell from 16.4 to -67.2. Only 0.3% of firms saw an increase in new orders. These are services firms which means this represents the largest part of the economy. You can’t have new orders if the entire economy is shut down. Sales index fell from -4.9 to -87.9.
Literally, zero firms had an increase in sales. That’s hard to do. Similarly, there were zero firms that increased the number of part time, temporary, and contract employees.
April labor report on next Friday is going to be a bloodbath. Unemployment rate should spike to near 15%. This report is confirmation of that. 6 month expectations index for the Philly economy fell from 36.9 to 45.8. For their personal business, expectations fell from -16.3 to -24.5.
It makes sense that some see greener pastures ahead because the economy will improve once this shutdown is over. Even with a complete shutdown, you won’t see all firms become negative. Only the firms that are close to not surviving should be negative.
More Money Added To Give To Small Businesses
On Tuesday, the government approved a $484 billion package to provide more relief to small firms because the previous package ran out on April 16th. Burn rate for the Paycheck Protection Program earlier this month was $50 billion per day. Keep that in mind when we talk about the numbers.
This deal allocates $320 billion for the Paycheck Protection Program. $60 billion of that would be for small firms. Half of the $60 billion would be for lenders with assets less than $10 billion and half would be for assets of between $10 billion and $50 billion.
Another $60 billion would go the Economic and Injury Disaster Loan program. $10 billion of that money would be in grants. This program, which is different from the PPP, went through the $10 billion in the first small business plan very quickly. The plan also grants $75 billion for hospitals and $25 billion for coronavirus testing. Testing is one way to end the shutdown because people will be cleared to go back to work. There will also be $2.1 billion for Small Business Administration expenses.
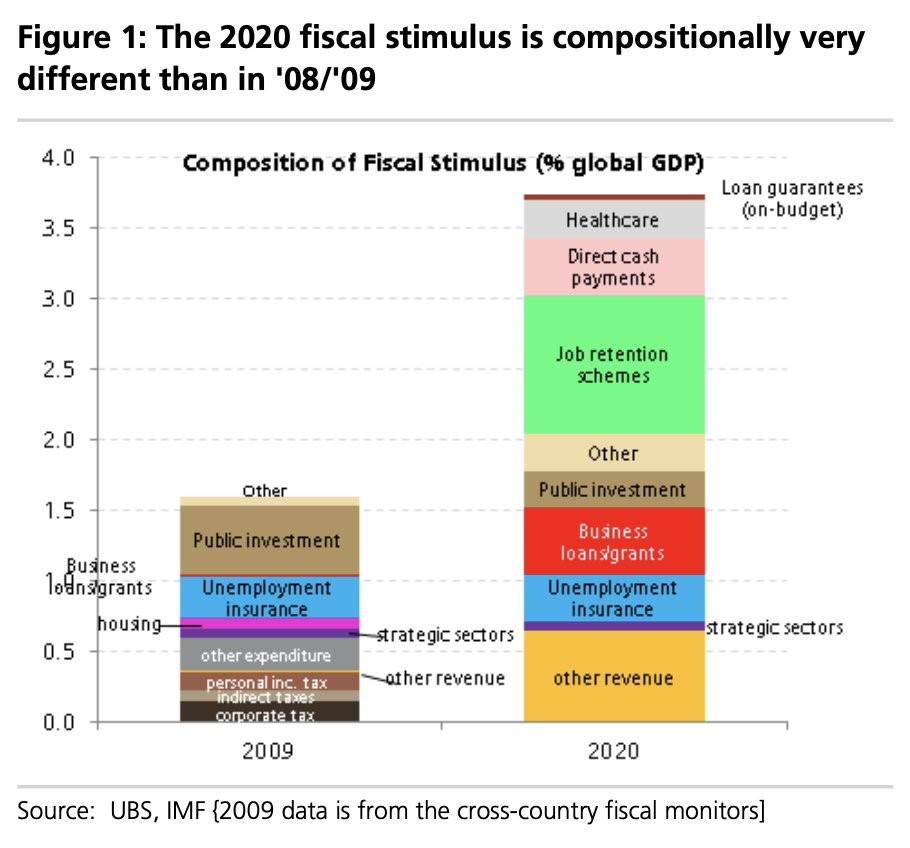
This Stimulus Versus 2009
Clearly this fiscal stimulus is much bigger than the one in 2009. It’s also earlier in the recession. You can see in the chart below how the 2 stack up. The bar on the right doesn’t include the recent bill that just passed to help small firms. It wouldn't be surprising if there is even more stimulus coming. It's needed until the economy opens again. This latest stimulus is being criticized because in some circumstances it is helping the rich or helping big businesses.
However, this stimulus is much more equitable than the one in 2009. A large portion of the money is going directly to consumers through unemployment insurance and direct payments. It’s not perfect, but it’s also not rewarding the people who crashed the economy. No one crashed the economy. This is a black swan event that wasn’t caused by anyone. It’s unlike the financial crisis which was partially the fault of bankers.
Weekly Leading Index Predicts Doom
NY Fed has come out with a Weekly Leading index. As you can see from the top chart below, it’s below -10% growth which is nearly triple as bad as the trough of the financial crisis. This is likely in tune with the National Chicago Fed index if it falls to where we think it will in April.
Could this recession be triple as bad as the great financial crisis? It will definitely be worse because the unemployment rate is already near 16% and it only peaked at about 10% in 2009.

What makes this weekly index especially interesting is it provides macroeconomic equivalents. You don’t need to calculate this on your own. As you can see from the middle chart above, yearly growth in industrial production is about to plummet from -5.49% to -36.95%. This growth rate troughed at -15.3% growth in the last recession. That means this recession will be at least more than twice as bad.
Worst growth rate ever was February 1946 which had a decline of 33.6%. Just by this metric, this recession will be worse than the Great Depression. However, it won’t have as negative effects because of the fiscal and monetary lifelines provided.
The third chart above shows there will be 1.49 million jobs lost in April. The trough in March 2009 was -800,000. This one will almost be twice as bad, because this estimate is too positive. It will likely be the worst decline ever. Previous worst decline ever was in September 1945 when the economy hemorrhaged 1.959 million jobs.
If much of the economy stays closed in May and there are continued job losses, the unemployment rate could peak at near 20% this recession.