Lower Income Gets Hurt Again
Poor and lower middle class always bear the brunt of recessions. That’s why the $1,200 stimulus check was targeted towards them. It would help if they got more money. But at the same time, unemployment insurance goes a long way towards helping people. Some people are making more money from being unemployed than working. Recessions increase inequality. This support from unemployment benefits might be reinstated in future recessions to lower inequality.
Remember, unemployment insurance is cyclical. It’s much better to lose your job in a recession than an expansion. It became harder to file for unemployment benefits and some were cut in this expansion. Few complained because so few people used them.
Plus, if someone called for more benefits, the counterargument would be to look for another job as they were plentiful. It’s painful to get laid off. But it’s fair to suggest looking for a new job quickly since there were more openings than people looking for work in the last couple years.

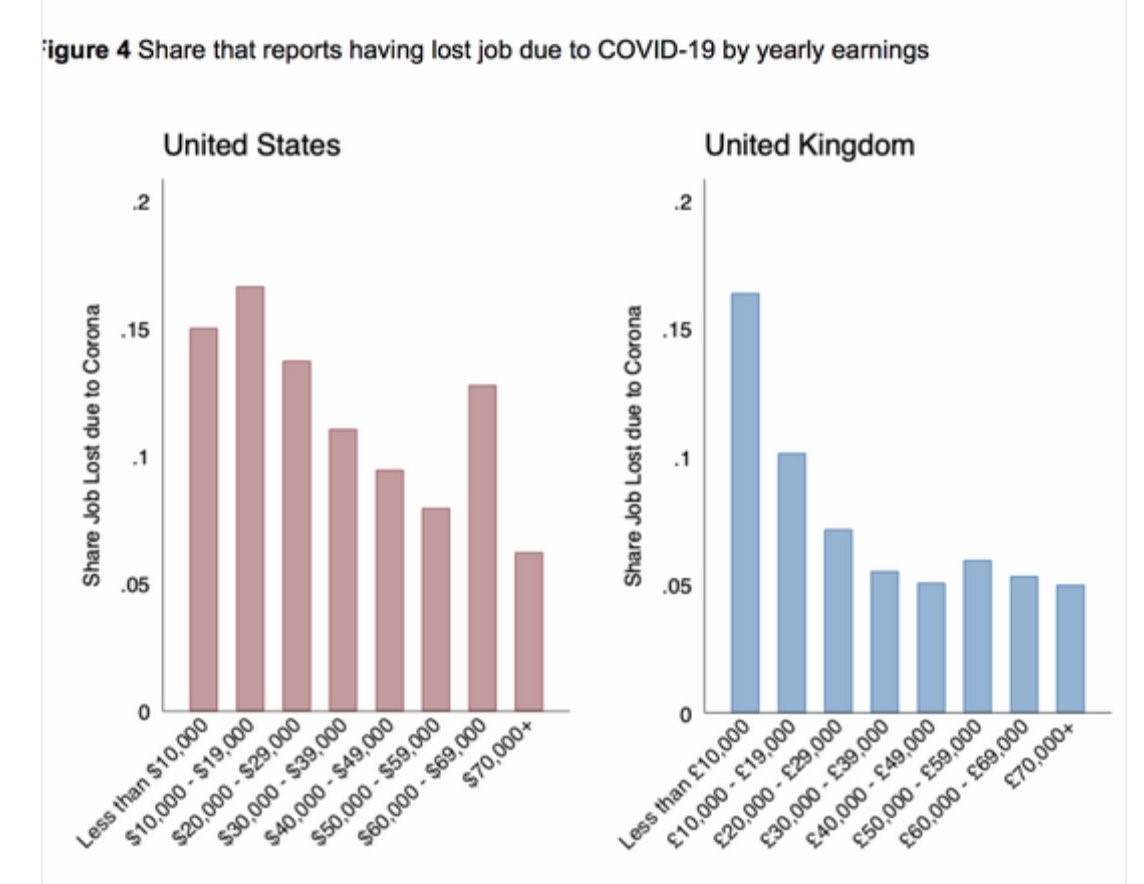
As you can see from the chart on the left, in America about 15% of people making less than $10,000 per year and about 17% of people making between $10,000 and $19,000 reported having lost their job because of the coronacrisis. Results were similar in the U.K. Low skilled workers are more abundant because it requires less investment to be in that position. Therefore, they are viewed as expendable by companies.
If someone has a degree, they become more in demand. They are less likely to lose their job. Obviously, essential workers like people who work in grocery stores have been the backbone of this economy. Goal isn’t to demonize anyone, just to describe how the cycle typically works.
We Knew This Decline Was Coming
It’s no surprise retail sales were down huge in March. Results will be even worse in April. Hoarding took place in March; it didn’t take place in April. Headline monthly retail sales growth was -8.73% which was worse than estimates for -7.3%. This is the worst sales growth since at least 1992.
Because of this easy comp, monthly sales growth might not be horrendous in April, but yearly growth will be much worse. We can expect food and beverage store sales to fall monthly in April. That’s because, as the table below shows, food and beverage store sales growth was 25.58% in March. Hoarding took place in the middle of March when the shutdowns where starting.
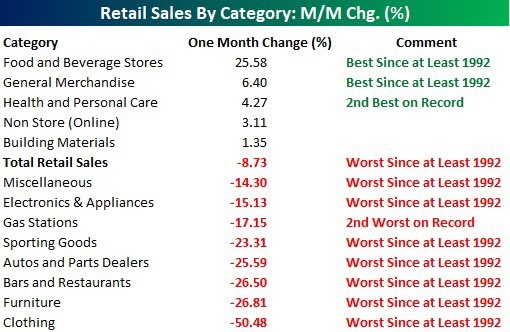
Retail sales excluding autos weren’t nearly as bad, as many expected. Sales growth was -4.5% which was slightly worse than estimates for a 4.2% decline. Excluding autos and gas sales, monthly growth was -3.1% which beat estimates for -4.5%. Gas prices have cratered and no one is driving.
As the table above shows, monthly sales growth at gas stations was -17.15% which was the 2nd worst growth on record. Shockingly, the control group had positive growth. Growth was 1.9% which destroyed estimates for -1.8%. It was way above the highest estimate which called for a 0.4% decline.
As you can see, clothing sales fell 50.48% monthly. That’s no surprise because the stores are shut down. There is no need for new clothes when there are no social gatherings. A 26.81% decline in furniture sales is surprising. There was a boost in work from home related furniture demand such as desks. That’s why Wayfair stock tripled from its March bottom.
On the positive side, online sales growth was 3.11%. This segment has a 14.24% weighting in the report. It’s usually the 2nd biggest, but it was the 3rd biggest in March. Food and beverage spiked to the highest weighting as it was 17%. March was the rare situation where general merchandise outperformed online sales as the former had 6.4% growth which was over double online sales growth.
Let’s quickly look at yearly growth. Retail sales excluding food services growth was -3.8% which wasn’t as bad as March 2009 which had -12.8% growth. April will have worse yearly growth than that trough. Since restaurants and bars were closed, yearly growth including foodservices was -6.2%. That’s much closer to the March 2009 trough of -11.5%.
That trough will easily be surpassed by April’s report. It could be as bad as -20% if not worse. Real retail sales growth was -7.6% which was near the November 2008 trough of -11.4%. Yearly non-store retail sales growth actually increased from 7.7% to 9.7%.
Housing Purchase Applications Fall
Housing market was on fire in the end of 2019 and the start of 2020. Now, it’s in disaster mode. April housing market index fell from 72 to 30. It missed estimates for 60 and the lowest estimate which was 53. Builder confidence fell below 50 for the first time since June 2014. Somehow every economist believed it would be above 50. Yet some estimates haven’t gotten bearish enough! When they get too bearish, it’s usually a bullish sign.
Present sales index fell from 79 to 36 and the future sales index fell from 75 to 36. Prospective buyers index fell from 56 to 13. We are likely close to a bottom in this index as the economy will start to reopen in May. It’s no surprise the Northeast was the worst hit as its index fell from 64 to 19.
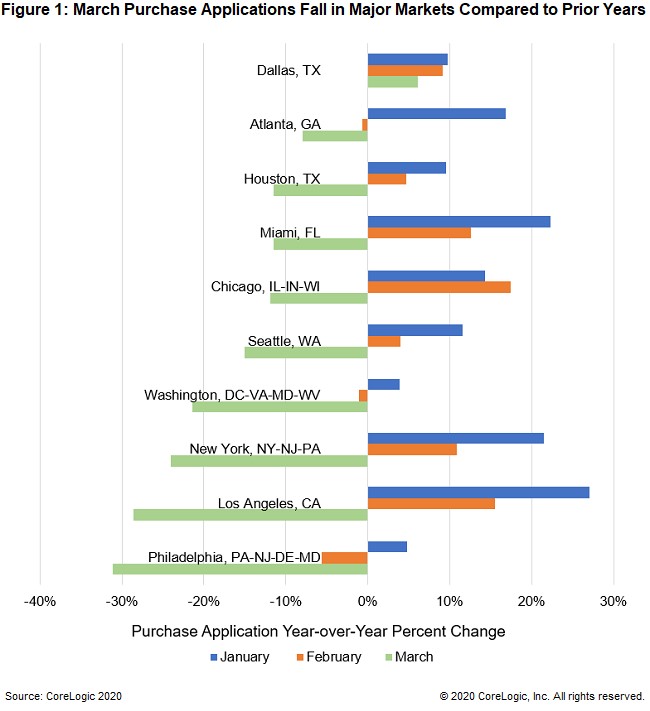
As you can see from the chart above, the March purchase applications index was down 24% yearly in the New York City metro area. With this huge decline in the housing market index in April, it's likely that purchase applications were down well over 30% in April.
Yearly sales growth was the worst in the Philadelphia area as it fell over 30%. In the Midwest, the housing market index fell from 67 to 25. Indexes in the South and the West, which are the first and second biggest regions, fell from 76 and 79 to just 34 and 32.