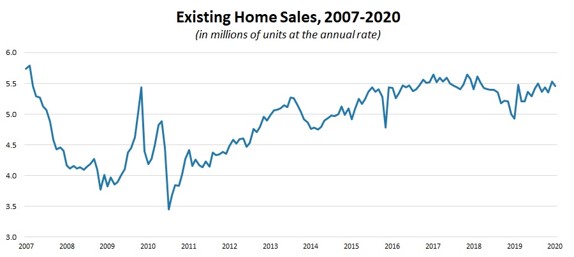
Existing Home Sales Fall Slightly
In January, existing home sales fell from 5.53 million to 5.46 million which was a 1.3% monthly decline. Sales beat estimates by 10,000 and were revised 10,000 lower in December. As you can see from the chart below, the sales rate has been consistent for the past 4 years other than the decline in the second half of 2018.
Because of the easy comp, yearly growth was 9.6%. That’s the last easy comp as sales spiked from 4.98 million to 5.38 million in February 2019. Remember, sales growth has been limited by the very tight supply. Number of months of supply increased from 3 to 3.1 in January. That’s below the 3.9 months of supply last year.
Total inventory is down 10.7% from last year; this is the lowest inventory since 1999. This tightness should inspire the building of affordable housing. That’s partially why starts have been strong recently. Other reasons are low rates and the warm weather.
Median sales price growth of existing homes was 6.8% (prices rose to $266,300). Existing homes are cheaper than new homes. If the difference converges, it provides further support for new homes to be built at the low end of the market. Breaking down sales by the type of house, single family housing sales fell 1.2% monthly and were up 9.7% yearly. Condo/co-op activity was down 1.6% monthly and up 8.9% yearly. Sales were weak in the West as they fell 9.4% monthly to 1.06 million (8.2% yearly growth).
Median prices were up 5.2% to $393,800. West is by far the most expensive housing market. Midwest had the strongest monthly growth as it was 2.4%. Yearly growth was 8.4% as sales were 1.29 million. Median price was $200,000 as prices rose 5.4%. South, which is the biggest market by far, had 0.4% monthly growth and 11.7% yearly growth. Median sales price was up 6.3% to $229,900.
Earnings Estimates Are Plummeting
According to FactSet, the S&P 500’s forward PE ratio is 18.9. The stock market and earnings have gone in the exact opposite directions expected for this year (ignoring the decline on Monday). Stocks were expected to have modest returns and earnings to be strong. But because of the coronavirus, estimates have fallen. Stocks seem to have risen because of the anticipated cyclical upturn, barring the coronavirus getting worse.
A new theme might be that the earnings weakness will extend into Q1, but after that we will see an acceleration in growth. I see modest gains in 2020 in stocks which means we still might eventually see multiple contraction. Current estimate for 2020 EPS growth is 7.7%. If stocks rise in the mid-single digits, there probably won’t be a change to the multiple. Excluding, Q1, there will be multiple contraction.
Just in case, you still think EPS estimates don’t matter, let’s review the results from Q4. 25% of the first 439 firms to report Q4 earnings had their estimates raised. Those firms are up 4.19% year to date which is 88 basis points above the market’s gain. Obviously, this doesn’t include Monday’s action. On the opposite side, 59% of firms who have reported earnings have seen their estimates fall. They are down 0.72% year to date. That’s 403 basis points below the market’s return.
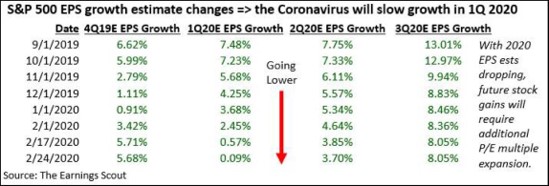
The table above shows the latest changes to EPS estimates in the next 3 quarters. We’ve seen blended EPS growth of 5.68% in Q4. At this point, the only reason that matters is that it’s a reference point for this coming quarter. We are very likely to see Q1 EPS growth come in below that of Q4 because at the start of the last month of Q4, EPS growth was expected to be 1.11%.
Q1 EPS growth estimates call for only 9 basis points now. And there’s a few days in the month left for them to fall. They probably will fall sharply because many firms haven’t quantified the risk of the coronavirus. Investors expect between 2% and 4% EPS growth by the time the reports are in. Hope is the coronavirus is contained. If it isn’t, stocks need to fall because they can’t justify current valuations.
Another Solid Regional Fed Index
February Dallas Fed manufacturing survey was solid, but unremarkable. It didn’t show as much strength as the other two, but it was in good shape considering the weakness in oil prices. It’s remarkable to see the difference between these readings and the Markit PMI. ISM report will be anyone’s guess.
If it is impacted by the coronavirus, it can be in the high 40s and if it’s in line with the regional Fed reports, it will be in the mid 50s. The market appears to be sensitive to coronavirus fears which means we might see a big dip if the PMI is weak.
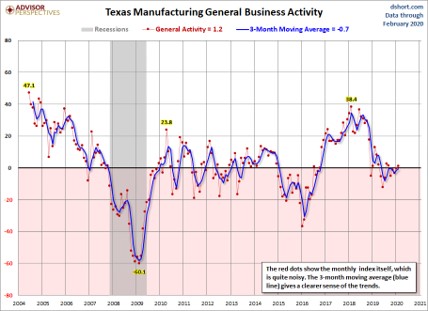
Dallas Fed general activity index rose from -0.2 to 1.2 as you can see from the chart below. It missed estimates for 2.1. Production index was up from 10.5 to 16.4. New orders index fell 9.2 points to 8.4. Outlook uncertainty index spiked from 2.7 to 11. That makes sense because the coronavirus is causing oil prices to plummet. 6 month expectations production index fell 3.9 points to 35. New orders and shipments fell 6 and 11 points to 34.1 and 27.3. Good news is the expected general business activity index rose 10.4 points to 18.
Coronavirus is the new topic to look for in the comments section of economic reports. It was mentioned by 4 different firms. It was mentioned by a non-metallic mineral product manufacturing firm and 3 computer and electronic product manufacturing firms.
One of the latter firms stated, “Coronavirus uncertainty has been introduced recently. It is impacting some of our customers with plants in China, which may disrupt future production schedules, dependent upon length of plant closures (commercial air and semiconductor manufacturers). We are seeing a mild impact on the supply chain out of China for some industrial components.”
China has been shut down for about a month and uncertainty reigns supreme about the virus’ effects in countries outside of China such as South Korea.