Weak January Retail Sales Report Lowers GDP Growth Estimates
January retail sales report wasn’t great mostly because control group sales growth was revised lower and missed estimates. Even still because of the tougher comp, there wasn’t much change in the 2 year headline growth stack. There wasn’t a big spike like what could have occurred based on the very strong consumer confidence reports.
But there’s no reason to worry about a recession either. If consumer spending continues to grow at this level, it won’t be enough to pick up the slack in the other areas of the economy which will be weakened by the coronavirus.
We are potentially looking at another quarter of near 2% GDP growth. As a result of Friday’s economic reports, Goldman lowered its Q1 tracking estimate by 0.3% to 1.4%. S&P 500 EPS growth in Q1 will be weaker than initially expected this year as well because of the coronavirus.
It should be in the low single digits if estimates are beaten by the average amount. It’s amazing that my prediction for EPS growth was too optimistic, but my prediction for stocks was too pessimistic. Takeaway is the coronavirus weakness is considered a one-time event and multiples are a bit elevated.
Specifics Of The Report
Monthly headline retail sales growth was revised lower by a tenth to 0.2% in December. It met estimates for 0.3% in January. Sales growth excluding autos was the same in that it was revised down 0.1% to 0.6% and met estimates for 0.3%. Motor vehicle and parts sales growth was solid which is what was expected because of the good motor vehicle sales report. That strength might not continue as the auto loan delinquency rate is high.
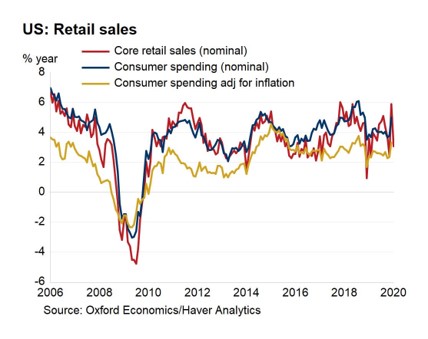
Excluding autos and gas had 0.4% growth which beat estimates by 0.1%. Control group sales growth was weak. Monthly growth in December was revised down from 0.5% to 0.3% and growth in January was 0% which missed estimates by 0.3%. It’s not good when the comp gets easier and results still miss that lowered bar. The chart below shows the decline in nominal core yearly retail sales growth.
Yearly advanced retail sales growth fell from 5.5% to 4.4%, but the comp went from 1.6% to 2.7%. That means there was only a small 0.1% decline in the 2 year growth stack. Remember not to look at yearly growth without looking at the comp because that makes this month look worse than it is. Yearly growth excluding food services fell from 5.4% to 4%, while the comp went from 1.2% to 2.6%. That means the 2 year growth stack had no change.
Finally, real retail sales growth fell from 3.2% to 1.8% which actually means the growth stack improved because the comp went from -0.4% to 1.6%. 2 year growth stack was up 0.6%. These 2 year growth stacks usually suggest there hasn’t been much change in consumer spending growth. Which isn’t a bad thing as the consumer has been steady. Obviously, there was a huge spike in control group sales growth last summer. That was unsustainable.
Retail Sales Growth By Segment
Yearly growth in the control group fell from 5.94% to 3%. Motor vehicles and parts sales growth improved. Yearly growth went from 3.54% to 5.72% and monthly growth went from -1.51% to 0.17%. Despite this improvement in yearly growth, headline growth fell because online sales growth plummeted. This is the opposite of December when motor vehicle and parts sales growth was weak and online sales growth was strong. Monthly non-store sales growth went from 0.17% to 0.29%, but yearly growth fell from 18.25% to 8.39%.
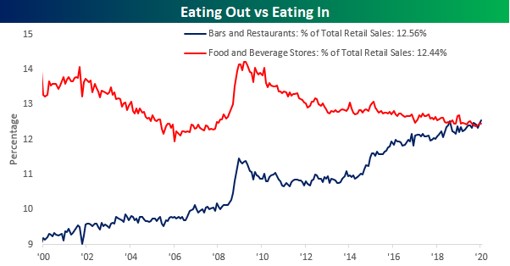
As you can see from the chart below, bars and restaurants are taking share from food and beverage stores. It implies the retail stores that are shuttered due to the shift to online stores will be replaced with restaurants and bars. Food and beverage stores’ yearly sales growth fell from 3.81% to 2.35%.
Yet food services and drinking stores saw an increase in yearly growth from 6.08% to 7.37%. A stereotype about millennials is they like experiences over possessions. That plays into the hand of bars and restaurants.
Decent Industrial Production Report
All things considered, the industrial production report was ok. It wasn’t as great as the regional Fed reports implied, but the 2 year growth stack in manufacturing production improved. Industrial production was hampered by the 737 Max’s delay and the warm weather which lowered utilities production.
Specifically, monthly industrial production growth was -0.3% which met estimates, while the December reading was revised down a tenth to -0.4%. Monthly manufacturing growth was -0.1% which beat estimates by a tenth. Its comp was pushed down a tenth to 0.1%. Capacity to utilization rate last month was revised up 0.1% to 77.1%, but it fell to 76.8% in January.
Monthly manufacturing growth ex-aircraft was 0.3% as growth was hurt by the 737 Max. Mining production was up 1.2% which is interesting because oil prices fell. Utilities production fell 4% because it was a warm month again. Yearly utilities production growth fell from -1.5% to -6.2%. Yearly industrial production growth improved 0.1% to -0.8%, while the comp was about 0.2% easier. The comp will fall from 3.6% to 2.7% in February which means growth might be positive in the next report.
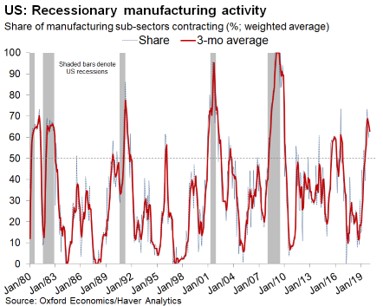
As you can see from the chart above, the weighted average share of manufacturing sub-sectors contracting increased, while the 3 month moving average fell. This manufacturing decline has been broader, but not as deep as the one in 2015 and 2016. Yearly manufacturing growth rose from -1.2% to -0.7%, while the comp only got easier by 0.2% (2 year growth stack up 0.3%).
Surely, yearly growth will be positive next month as the comp goes from 2.7% to 1.1%. I think we have reached a bottom in the sector which is why stocks have rallied. Low was -1.5% yearly manufacturing growth in October which is above the bottom of -2.1% in November 2015.