Home Price Growth Rises Again
Even though yearly FHFA home price growth fell very slightly, it has been clear for the past few months that home price growth is bottoming. Monthly price growth in the 20 city Case Shiller index was 0.5% in November which beat estimates and the prior reading of 0.4%. Monthly non-seasonally adjusted price growth was 0.1% and yearly non-seasonally adjusted price growth rose from 2.2% to 2.6%.
As you can see from the chart below, yearly national non-seasonally adjusted price growth rose from 3.3% to 3.5%. Big cities are still underperforming national housing. Consumers probably are becoming more confident about housing prices rising. There are more people who own a home than people trying to buy a house. Homeownership rate is 64.8% and not all people who don’t own are looking to buy a house. That means home price growth is a net positive for the consumer.
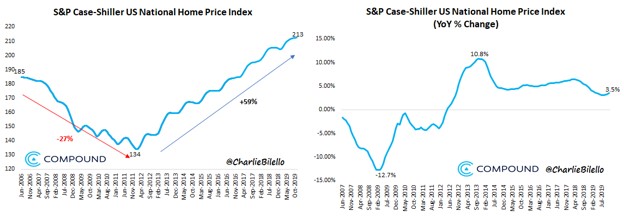
On the negative side, 2 year growth stack in national home prices fell, so be careful of assuming the housing market is on fire. This is a slow and steady recovery. It will be interesting to see how growth does in September 2020 when the comp starts to get harder.
Specifically, yearly growth last year fell from 5.3% to 5% which means the 2 year growth stack fell by about 0.1%. Price growth will definitely improve in the next few months as the comps will continue to get easier. I foresee above 5% growth this spring.
Looking at individual cities, price growth in Phoenix improved from 5.8% to 5.9%. It had the strongest growth, but Charlotte is catching up as its yearly price growth was up from 4.8% to 5.2% which was its highest growth since November 2018. Price growth in Las Vegas stopped falling for the first time since August 2018 as it rose from 2.2% to 2.6%.
The comp was 0.8% easier, so the 2 year growth stack still fell. 2nd weakest city was San Francisco which had 0.5% growth which was up from -0.5%. Weakest city was Chicago which had 0.4% growth which was up 0.1% in October.
Disappointing Pending Home Sales
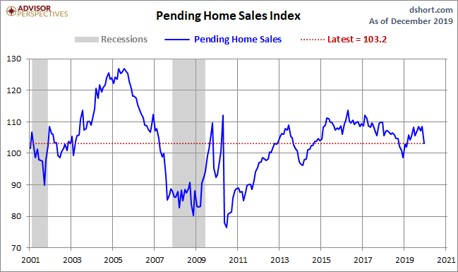
Now we have had 2 disappointing housing reports this week as the pending home sales index fell 4.9% monthly in December. That was down from 1.2% growth and missed estimates for 0.4% growth. No estimates expected a decline.
As you can see from the chart below, the index fell from 108.5 to 103.2. This was the largest decline since May 2010 and the largest negative surprise in 5 years. NAR’s chief economists blamed a lack of supply for this drop. He stated, “The state of housing in 2020 will depend on whether homebuilders bring more affordable homes to the market. Home prices and even rents are increasing too rapidly, and more inventory would help correct the problem and slow price gains.”
It appears homebuilders are focused on affordable housing as existing home inventory is low. Existing homes provide competition for new homes on the low end. There is less competition by existing home inventory being at a record low.
Within this report, every region had a monthly decline. Pending home sales index was down 4% in the Northeast, 3.6% in the Midwest, 5.5% in the South, and 5.4% in the West. Remember, the South had a big decline in new home sales and the West had a big increase.
MBA Applications Spike
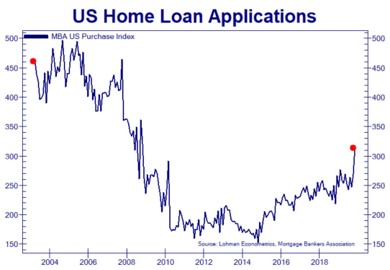
Despite the sequential weakness in new and pending home sales, the MBA applications report in the week of January 24th was strong. It has been strong all month.
As you can see in the chart below, the purchase applications index rose to the highest level since the 2008 housing bust. Composite index was up 7.2% weekly after falling 1.2%. Purchase index was up 5% after falling 2% and the refinance index was up 8% after falling 2%. Yearly purchase applications growth was 17%.
GDP Estimates Before Report
St. Louis Fed and NY Fed Nowcasts will be updated one final time on Friday, but that doesn’t mean much because by then we will have the advanced GDP report which comes out on Thursday. Consensus calls for 2.1% growth with 1.9% real consumer spending growth and 2% price growth.
As you can see from the table below, the average Nowcast estimate is 1.83%. I’m expecting growth between 1.7% and 2.1%. My original estimate range from a couple months ago looks good. If growth is weak, the stock market will probably ignore it because expectations are for a rebound in 2020.
Only Nowcast that had its update before the GDP report was the Atlanta Fed. It lowered GDP growth its estimate by 0.1% to 1.7% as the advance economic indicators report caused it to cut its estimate for real gross private domestic investment growth from -2% to -2.5%.
Fed Doesn’t Raise Rates
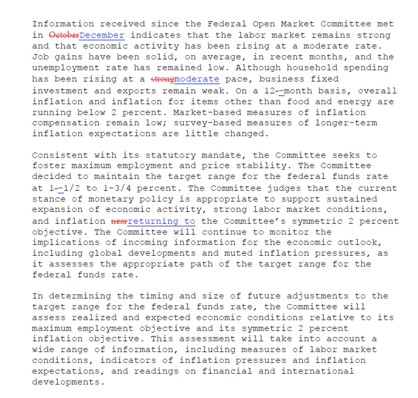
As expected, this was a relatively boring Fed meeting. Fed kept rates the same as they stayed in the range between 1.5% and 1.75%. Very little changed in the statement seen below. Household spending growth is “moderate” instead of “strong.” Inflation is “returning to” its goal of 2% instead of “nearing” 2%.
Powell stated, “We wanted to underscore our commitment to 2% not being a ceiling, to inflation running symmetrically around 2% and we’re not satisfied with inflation running below 2%.”
Fed is willing to let inflation run hotter. It’s more concerned with low inflation than inflation going too high. That means rate hikes are far from a possibility this year in my opinion. In response to a question about the stock market, Powell stated, "we do see asset valuations as being somewhat elevated."
That doesn’t mean much if the Fed doesn’t plan to hike rates to quell the possibility of a bubble forming. Personally, I don’t think a bubble in asset prices is likely.
Conclusion
Home price growth increased modestly, pending home sales were weak, and home purchase applications spiked. Q4 GDP growth is likely to be between 1.7% and 2.1%. Fed meeting was bland as the Fed didn’t move rates and probably won’t move them at the next meeting in March.