Consumer Looks Great
Consumers had a great December which should boost PCE growth and GDP growth. Expectations for a strong holiday shopping season appear to have been met. But let’s wait until the retail sales report comes out before we declare victory. Wal-Mart, Amazon, Costco, and Target all did great. Sales are shifting online. But that doesn’t mean online exclusive stores are the only firms that did well. Buying online and picking up the products in store is very popular.
Weekly Redbook report from the week of December 21st showed 6.2% same store sales growth which improved from 4.6% growth. Most important shopping day of the year is actually Super Saturday. Meaning, the best time of the year did much better than last year. It’s impressive that growth was strong given the tough comp. This December Redbook same store sales growth will be closer to retail sales growth than last December. Redbook sales growth is a few points lower and retail sales growth will at least be a couple points higher.
Mastercard released data on retail sales which shows it was a good holiday season. SpendingPulse report by Mastercard uses sales activity from Mastercard’s payment network and estimates cash and other forms of payments. These estimates and seasonal adjustments will make the retail sales reports different from this data.
From November 1st to Christmas Eve retail sales excluding autos growth was 3.4%. Online sales growth was a fantastic 18.8% which pushed its market share up to 14.6%. Brick and mortar sales growth was only 1.2%. That’s relatively weak, but stronger than the growth on Thanksgiving and Black Friday combined. Later in the season when people have a time crunch, it makes more sense to buy gifts in the store because it might not ship in time for the holiday.
Chicago Fed National Activity Index Improves
Chicago Fed National Activity index improved sharply in November after cratering in October. If the index stayed where it was in October for 2 more months, it would have signaled a recession. That was the 2nd weakest reading since early 2014. There was one weaker one earlier this year.
November update was the strongest reading since early 2018. Specifically, in October, the index was -0.76. It had a negative revision of 5 basis points. September report was revised down 9 basis points to -0.54.
Despite those negatives, this was still a great report as the index rose to 0.56 in November. That pushed the 3 month moving average up 10 basis points to -0.25. All 4 of the categories increased from October and 2 made positive contributions to the index.
Production and income made the biggest positive contribution by far. It went from -0.6 in October to +0.49 in November. That’s because of the solid monthly growth in industrial production. 2 negatives were very small. Within the diffusion index, 50 of 85 indicators made positive contributions and 35 made negative impacts. 64 indicators improved sequentially and 21 got worse. Of the 21 that go worse, 19 made negative impacts.
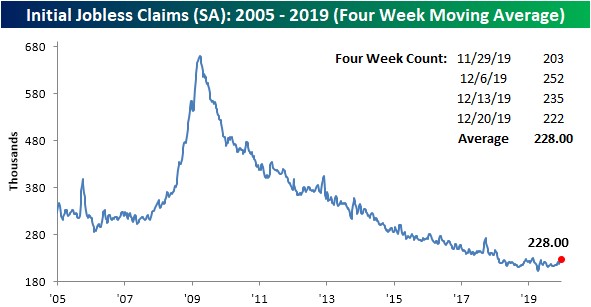
Jobless Claims Fall
Jobless claims in the week of December 21st fell again because the spike was due to the timing of Thanksgiving. As you can see from the chart below, claims fell 13,000 to 222,000 which was 1,000 below estimates. 4 week moving average spiked to 228,000 from 225,750. Claims were very low in the week that was just excluded from this average. The average will go up again next week because the week with 203,000 will come out of the average. Then in the following week it will fall because the spike will come out.
Ultimately, this has little impact on how I see the labor market. It’s still in solid shape despite this year’s decline in corporate margins. Goldman Sachs expects margins to increase next year. That could spur hiring a bit, not that the labor market is weak now. Because continuing claims data is a week behind initial claims, they were a relatively high 1.719 million. They will come down in the next few reports.
Another Weaker Regional Fed Manufacturing Report
In a month where it was expected the manufacturing sector to show improvement, 4 of the first 5 regional Fed manufacturing indexes fell. And the Markit flash reading fell slightly. Average of the 4 indexes predicts a 49 manufacturing ISM PMI. Unless the Dallas Fed index is strong, this will be the first time the regional Fed indexes predict a below 50 PMI.
Many had been looking for an improvement in the PMI with it staying below 50. However, with the latest data, I’m starting to expect we see one last weak PMI before the recovery starts next year. Regional Fed indexes mostly suggest there wasn’t an increase in optimism despite phase 1 of the trade deal being completed.
Specifically, the manufacturing index fell from -1 to -5 which missed estimates for 1. I’m surprised any economist expected an increase after the prior 3 reports fell. Shipments index fell from -2 to -6 and the volume of new orders index fell 10 points to -13.
Local business conditions index and the capex indexes fell and rose 11 points each to -6 and 12. Expectations category doesn’t have an index, but the individual categories showed some strength. Shipments index rose 7 points to 38. Volume of new orders index fell 1 point to 29. Finally, the local business conditions index rose 11 points to 27.
Conclusion
The consumer had a good holiday shopping season. Chicago Fed National activity index spiked in November unlike the leading economic indicators index. Jobless claims fell again because there is no weakness in the labor market outside of what was caused by seasonal factors.
Richmond Fed manufacturing report wasn’t terrible, but it’s a bad sign that all 4 of the reports fell in December. I was expecting Q4 to be the bottom in manufacturing for the mini cycle. That’s still possible, but it looks like the sector will end the year and quarter on a sour note.