Existing Home Sales Disappoint
Considering how great housing starts, permits, and home builder sentiment were, it’s surprising the November existing home sales report was weak. It wasn’t a disaster, but it did fall from last month and miss the low end of the expectations range. Existing home sales in October were revised from 5.46 million to 5.44 million. That pushed down monthly and yearly growth from 1.9% and 4.6% to 1.5% and 4.2%. It was still the 4th best reading of 2019.
November report was weaker as sales fell to 5.35 million which missed estimates for 5.45 million and the low end of the expectations range which was 5.37 million. This was the 7th best report of the year (2 reports were 10,000 higher). This means monthly growth was -1.7% and yearly growth fell to 2.7%. It’s not terrible, but you’d expect very strong yearly growth. Q4 2018 was terrible for the housing market.
Inventory fell from 4 months to 3.7 months. Inventory is limiting sales growth. You can tell sales growth was hurt by supply because the median price increased 5.4% yearly to $271,300. Sales to first time buyers rose from 32% to 33%. 84% of sales were for homes costing $500,000 or less. Sales growth of homes costing $100,000 or less was -15.9% because as prices appreciate very few homes are in that category. Homes are also leaving the $100,000 to $250,000 category as its growth was -3.5%.
Final Revision To Q3 GDP Report
With the final revision of the Q3 GDP report showing there was still 2.1% growth in Q3, this quarter extends the expansion. It’s now at 123 months which is 3 months longer than the one in the 1990s which was the longest since the 1800s. Going back to the 1850s, this is likely the first decade without a recession. The highest number of recessions in a decade was 4 which happened twice. Since the 1930s, there has been either 2 or 1 recession each decade.
It's possible there will be 1 recession in the next decade. The economy has gotten less volatile with the decline in the manufacturing sector as a percentage of the economy. Real consumer spending growth was revised up from 2.9% to 3.2% which beat estimates for 2.8%. The consumer has been dragging growth higher in the past 2 quarters. I think it will do the same in Q4.
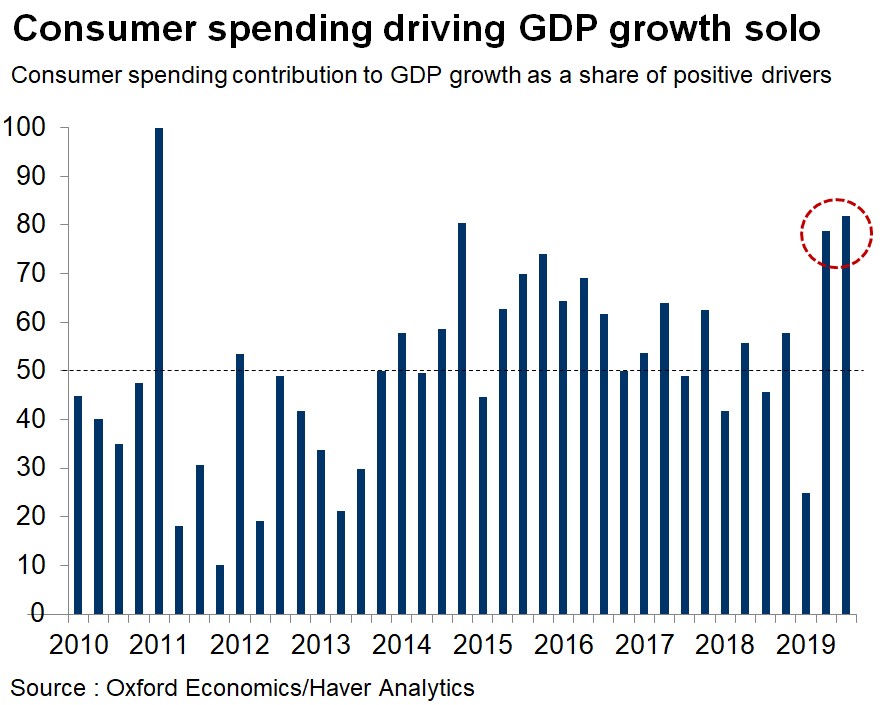
As you can see from the chart below, consumer spending’s contribution to GDP growth as a share of positive drivers was about 80% in the past 2 quarters. Last quarter had the highest percentage since 2011.
Spending on services was up 2.2%. Business investment fell 2.3% which was the biggest decline since Q4 2015. This is where the slowdown is the most obvious. Business investment spending will likely fall in Q4 as well. It should rebound along with corporate profits in 2020.
Corporate profits have much more room to rebound than S&P 500 non-GAAP EPS which should end 2019 with positive growth. Specifically, U.S. corporate profits fell $4.7 billion in Q3 and were up $75.8 billion in Q2. That was driven by domestic non-financial corporate profits and international profits. Q3 had the 3rd contraction in the last 4 quarters. Profits were down 1.2% year over year and margins were still compressed at 9.6%. They have fallen for almost 5 years which is the longest downtrend since WWII.
Getting back to the Q3 GDP report, residential investment was up 4.6% after declining for 6 straight quarters. It will be up again in Q4 as the housing starts reports have been strong. Existing home sales have no impact on GDP. Inventories were neutral for growth and trade helped it by 0.1%. Government spending was up 1.7%.
Solid November PCE Report
November PCE report was solid since I put more weight on income growth than spending growth. Consumers will always have the opportunity to spend if they have a job that’s paying well. Sometimes spending is delayed. Savings rate increased in a month where you’d think there was less savings because of the holidays.
Yes, the data is seasonally adjusted, but we still expected a decline in the savings rate. Spending shifted from November to December because of the late Thanksgiving and the seasonal adjustments didn’t fully account for this. Investors expect consumption and retail sales growth to be very strong in December.

Monthly personal income growth was 0.5% which beat estimates for 0.3% and the highest estimate by 0.1%. The prior month was revised 0.1% higher to 0.1%. Consumer spending growth was 0.4% which met estimates and was above October’s 0.3% growth.
As you can see from the chart above, real yearly personal consumption expenditures growth was 2.4% which was about 3 basis points above last month. 2 year growth stack was down 17 basis points.
Real yearly disposable personal income growth increased from 2.88% to 3.12%. year growth stack was up 7 basis points. Best part of the report was real personal income growth which increased from 3.04% to 3.34%; that was the highest growth rate since February.
It had a 6 basis point increase in its 2 year growth stack. December comp will be extremely easy for spending growth. But it will be slightly tougher for income growth. Since income growth was above spending growth, the savings rate increased 1 tick to 7.9%. It’s relatively high compared to the past 20 years.
Conclusion
Existing home sales were disappointing, but the housing market is still fine. Q3 was great for the consumer. It drove Q3 GDP growth as business investment fell. Q4 is on pace to have slightly lower consumer spending growth. But investors think December will be a very strong month because of the later Thanksgiving. This is the first decade without a recession as this expansion is 123 months old. Personally, I think it will last another couple years.