Jobless Claims Fall As Expected
Last week jobless claims skyrocketed 49,000 probably because of seasonal reasons. That week has the most variance of the year which means it’s the least important report. Personally, I never overreact to one week of data, but that added another reason to ignore the spike.
As expected, claims fell in the latest report from the week of December 14th. They were down from 252,000 to 234,000. That’s still elevated, but not nearly as problematic. It was 13,000 above the consensus and 1,000 below the highest estimate. Personally, I think there’s still some seasonality left, meaning claims will fall a bit more next week.
4 week average rose 1,500 to 225,500. Because claims were very low in the first 2 weeks of the current 4 week average, the 4 week average will likely increase next week. It won’t spike as much as the weekly reading last week though which is why it’s looked at more seriously than the weekly reading.
Terrible Leading Indicators
Leading indicators report is really predictable because it works in trends and we know most of the data ahead of time. It has been easy to see for the past few months that the yearly growth rate was going to see some tough readings late this year.
Sure enough, the November report showed the lowest yearly growth rate of the cycle as it was 0.1%. However, I think this growth rate will bottom in December or January as ISM manufacturing report improves. Specifically, October’s monthly growth rate was revised down 0.1% to -0.2% and November’s growth was 0% which missed estimates by one tenth.
This November reading follows 3 consecutive monthly declines, so that’s a small positive. The stock market helped this index significantly, but the ISM manufacturing new orders index hurt it significantly. I think the latter will reverse soon.
In the past 6 months the leading index was down 0.2% which is down from the 0.3% growth in the prior 6 months. The good news is there were more positive than negative components. The manufacturing ISM report was just really bad as the new orders index fell from 49.1 to 47.2.
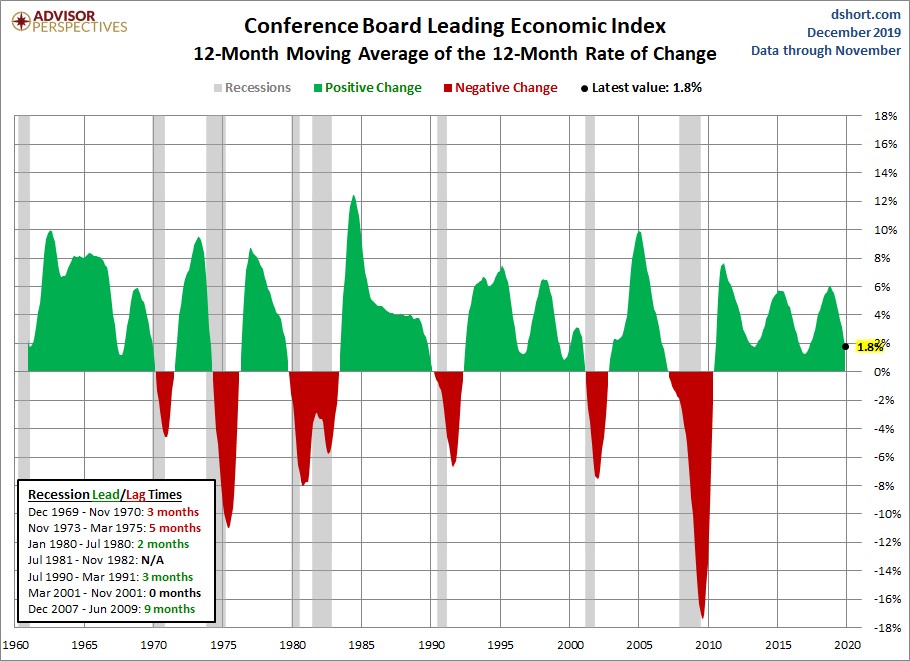
6 month moving average of the 6 month rate of change was 0.2%. It has never gone negative this cycle. Negative readings lead recessions by between 2 and 15 months, but there have been 2 false recession calls since 1960. If this goes negative, which it might, it will be another false reading. Remember, stocks are up, but jobless claims spiked in the first week of the month. The chart below shows the 12 month moving average of the 12 month rate of change.
As you can see, the growth rate has fallen to 1.8%. Sometimes this index is late in predicting recessions, but it has never had a false recession reading. Many expect this growth rate to get below where it was in 2017, but not go negative.
Current conditions index was up 0.9% in the past 6 months. It’s bad news when the current index rises faster than the leading index, but I think this will reverse in 1H 2020. That growth rate is actually faster than the previous 6 months which had 0.6% growth.
All metrics in the current index were up. This report suggests that the current economy is better than where it is headed. I disagree. I think of the leading index as more of a current index and the current index as more of a lagging index.
Now, I do respect the leading ECRI index more because it actually leads activity. It predicted the current slowdown 12 months ago. ECRI current conditions in the month of November was just updated. The index rose 0.3 to 187.3 and the growth rate stayed the same at 1.8%.
If this is the bottom, the current slowdown wasn’t as deep as the previous one. This is a great sign that the economy is near its trough. The leading index, which will be updated Friday, signals modest improvement is coming next year.
Philly Fed Manufacturing Index Falls
Technically, it’s bad news all around for the manufacturing sector because the flash Markit manufacturing & output PMIs, the Empire Fed, and the Philly Fed indexes all fell in December. I’m still optimistic on the ISM PMI because it has been too negative. But my expectations for the bottom to be hit in the sector have been pushed back another month.
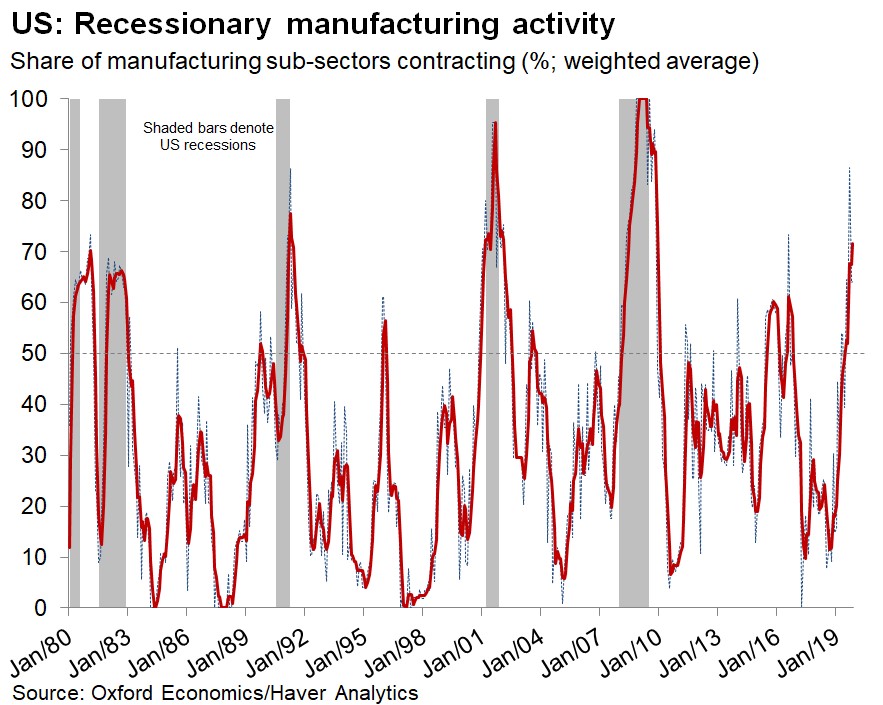
Even though both the Empire Fed and the Philly Fed indexes fell, they still are predicting a 51 ISM PMI which is above last month’s reading of 48.1. As you can see from the chart below, in the November industrial production report, the 3 month average of the share of manufacturing sub-sectors in contraction rose, but the monthly percentage fell. It was helped by the end of the GM strike ending, but this is still a good sign for the breadth of the sector.
Specifically, the Philly Fed diffusion index fell from 10.4 to 0.3 which missed estimates for 8.5 and the low end of the estimate range which was 6. New orders index was up 1 point to 9.4 and the shipments index was up from 9.8 to 15.9. Most individual categories were up despite the headline decline. 6 month expectations index fell slightly from 35.8 to 35.2. New orders and shipments fell from 40.3 and 41.4 to 35.6 and 39. Capex index rose from 19.4 to 27.6. This report was far from a disaster, but I was expecting it to be a bit better.
Conclusion
Jobless claims fell as expected. They will fall further in the next few weeks. The labor market is strong. A main reason the leading indicators index is in the doldrums is the manufacturing ISM which is below the other measures of the manufacturing sector.
So far, the regional Fed reports have gotten slightly more negative than last month, but they’re still more optimistic than the ISM report. Many are expecting the manufacturing sector to have a rebound in 1H 2020. That’s actually a negative signal for returns next year as stocks do better when the PMI is below 50.
1 Comment
Ashok Ajgaonkar
December 20, 2019this shows the in coming problems to those in several past yrs as Don Kaufman had mentioned the other day.