Openings Increased & Hiring Fell
October JOLTS report wasn’t great because hiring fell. Openings being up doesn’t counter the decline in hiring as openings have been above hiring for a few years. If an opening doesn’t lead to a hire, it doesn’t matter much. If openings being above hiring made you think the labor market was full, you would have been extremely mistaken for 4 years.
The labor market has defied the Fed’s estimates by getting fuller in the past few years. Remember, the last JOLTS report was strong because hiring increased. To be clear, all of the reports this year have been great on an absolute basis. But I’m looking at the data on a rate of change basis because I’m trying to determine if the cycle is near completion.
Specifically, openings were up from 7.032 million to 7.267 million which beat estimates for 7.015 million and the high end of the estimate range which was 7.1 million. As the chart below indicates, it seems that job openings have peaked. The highest reading of the cycle was last November.
Yearly growth increased from -4.9% to -4.3%. September’s growth rate was the worst since March 2017. The weakest growth of the cycle was in January 2017 which had growth of -5.9% You can see openings growth lagged the overall economy because the slowdown ended in mid-2016. This slowdown might be near its end as well. 1H 2020 should see improvement.
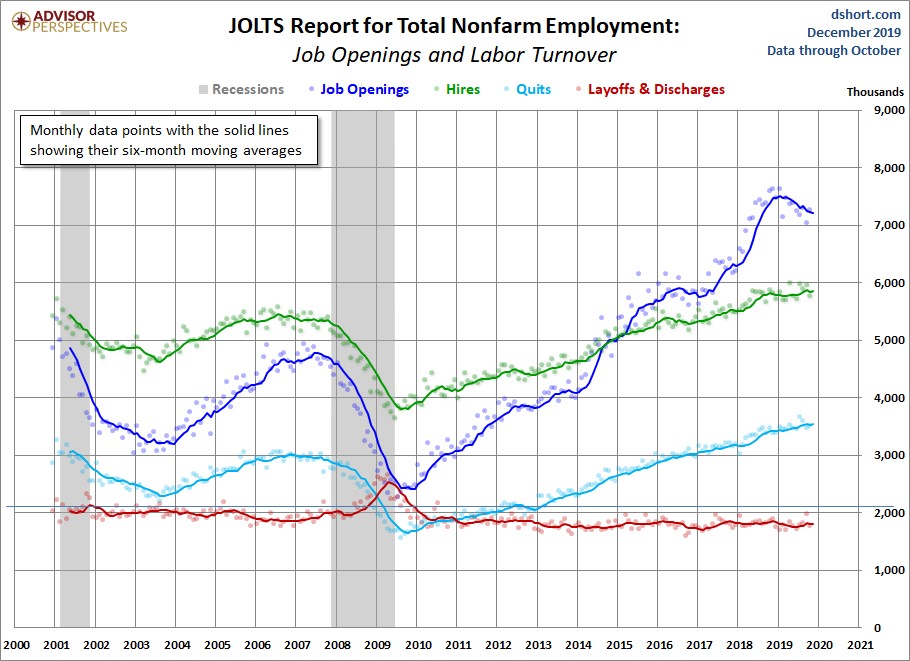
Hiring data has recently been better which has narrowed the gap between it and openings. However, this report increased the gap a bit as hiring fell from 5.951 million to 5.764 million. Cycle peak in hiring was this April. Yearly growth fell from 5% to -1.9% which is the weakest growth rate since June.
There have been a few monthly reports with negative growth this cycle, but declines have been short lived. That makes the next couple reports pivotal. Given how strong the November BLS report was, I’m not worried about hiring.
Hiring in construction was extremely strong as yearly growth was 33.6% which is the highest growth since January 2017. That’s in tune with the strong housing starts report. Hiring in manufacturing was likely hurt by the GM strike. Its yearly growth was -16.5% which was the weakest since March 2013.
Growth was very weak in retail trade as well as it was -12% which was the worst growth since November 2016. This was the 2nd worst reading of the cycle. However, hiring may have improved in November because of the holiday shopping season.
Finally, the quits rate stayed at 2.3%. It is 0.1% below its cycle high. Private sector quits rate increased from 2.5% to 2.6%. Its cycle high was 2.7%. Biggest increases were in arts, entertainment, & recreation and accommodation & food services as they increased from 3.1% and 4.7% to 3.5% and 5%.
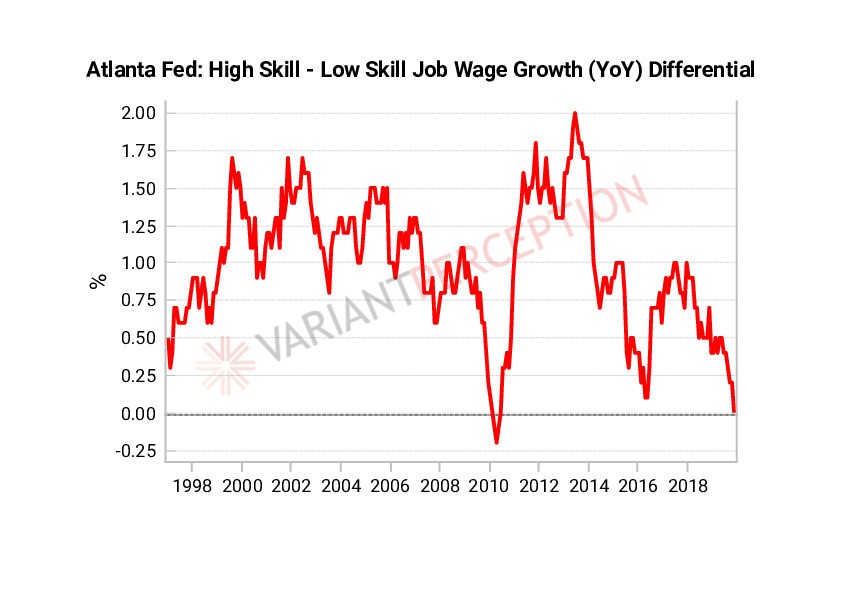
5% quits rate in accommodation and food services is down from its cycle high of 5.3% in August. In general, low wage workers have had a great year. As you can see from the chart below, high skill minus low skill wage growth is near 0% which is the lowest difference since early 2010. Arts, entertainment, and recreation quits rate peaked at 3.7% in October 2018.
Updated Recession Barometer
Credit Suisse recession barometer was updated in December. Results are obvious; there is no recession. Even though GDP growth could be below 1%. Personally, I see growth coming in at 2%, but below 1% is a possibility since that’s what the NY Fed Nowcast shows.
As you can see, the yield curve is considered neutral. It’s debatable what this signal shows unlike the rest. That’s because the curve is steepening after an inversion. Usually, that occurs during recessions. On its own, a relatively flat curve is better than an inverted curve, but context is key because it depends on where it’s coming from. I’m predicting the inversion this year won’t lead to a recession. But I’d debate this signal should be recessionary.
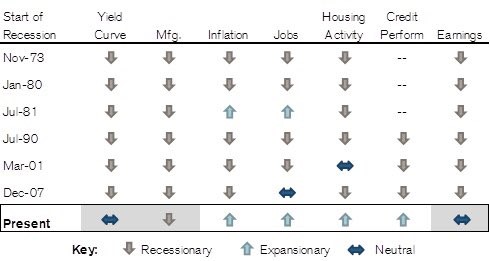
Only negative reading is manufacturing which is obvious. CPI recently increased and core CPI recently fell. Inflation isn’t recessionary. Labor market is generally strong as this is the longest string of job creation by far ever before. Housing activity is amazingly strong as shown in the permits reading. Credit markets are open.
Earnings is considered neutral which seems fair since FactSet shows blended 2019 EPS growth is 0.3%. According to The Earnings Scout, with 6 firms reporting Q4 earnings, 83% have beaten EPS estimates and 50% have beaten sales estimates.
Non-GAAP EPS growth is 2.2% and sales growth is 3.4%. Total corporate profits are down this year though. Bears are trying to press their position because economic growth is weak. But growth about to head higher, making their recession calls very wrong.
Valuations Are Expensive Or Are They?
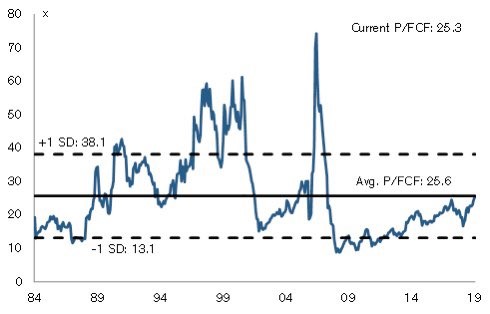
According to Credit Suisse, EPS multiples are one standard deviations above normal. However, the firm isn’t bearish because the price to free cash flow ratio seen in the chart below is only near average. They also mentioned historically low interest rates and equity risk premiums.
Therefore, they believe valuations have further to run. I’m doubtful of this analysis as I see the stock market having a below average year in 2020. Also I think if stocks are to have a good year. And earnings and the economy will surprise to the upside rather than valuations simply going to the moon.
Conclusion
Rate of change of hiring was weak, but let’s not go bearish because of that since the November BLS report was strong. Low skill wage growth is finally matching high skill wage growth because the labor market is near full employment.
This usually happens at the end of the cycle, but not this time. There probably won’t be a recession for the next 2 years. I think stocks won’t return much in 2020 because they are fully valued. Credit Suisse thinks valuations have more room to run.