Fund Managers Have Gotten More Optimistic
A few months ago, investors in the Bank of America survey were calling for a recession. That has changed as we have seen in the recent surveys. As you can see from the chart below, the yearly change in the global manufacturing PMI has improved, but it’s still negative. Net percentage of fund managers saying global profits will improve has gone from near -100% at the start of the year to about +60%.
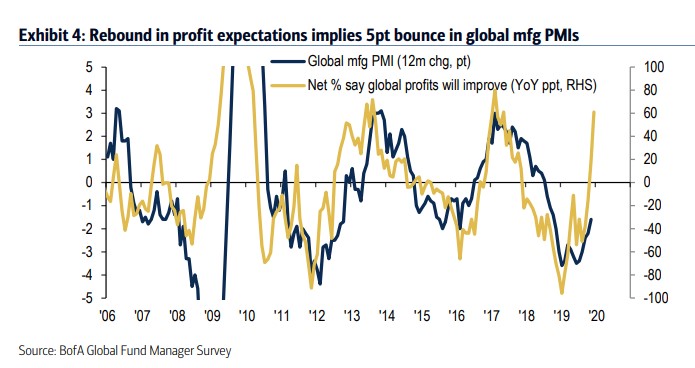
As you can see, after the bottom in 2008 and the slowdown in 2012, fund managers were early in predicting economic improvement. After the 2016 slowdown, optimism improved in line with economic recovery. Optimism may have been delayed by Brexit and the 2016 U.S. presidential election.
After Donald Trump won, investors started to realize the obvious: growth was starting to accelerate. Best time to buy stocks is when the PMI is low and increasing like it is now. If yearly growth in the PMI increases in the next few months, most of the upside will be over. That’s partially why many see very little upside in 2020. Several expect the S&P 500 to barely increase (up 3% to 5%).
Industrial Production Improves Because GM Strike Ends
Monthly industrial production growth was strong because of easy comps and the end of the GM strike. Monthly growth doesn’t tell you as much. Yearly growth since we’ve been seeing a vacillation between tough and easy monthly comps. Specifically, monthly production growth was 1.1% which beat estimates for 0.9%. That was on top of -0.9% growth which represents a 0.1% revision lower.
Growth rates mostly canceled each other out. On a monthly basis, manufacturing did a bit better because growth improved from -0.7% (revised down from -0.6%) to 1.1% which beat estimates for 0.7%. The issue is the GM strike helped manufacturing more than industrial production. Excluding the 12.4% increase in motor vehicle and parts production, monthly industrial production growth was 0.5% and manufacturing growth was 0.3%.
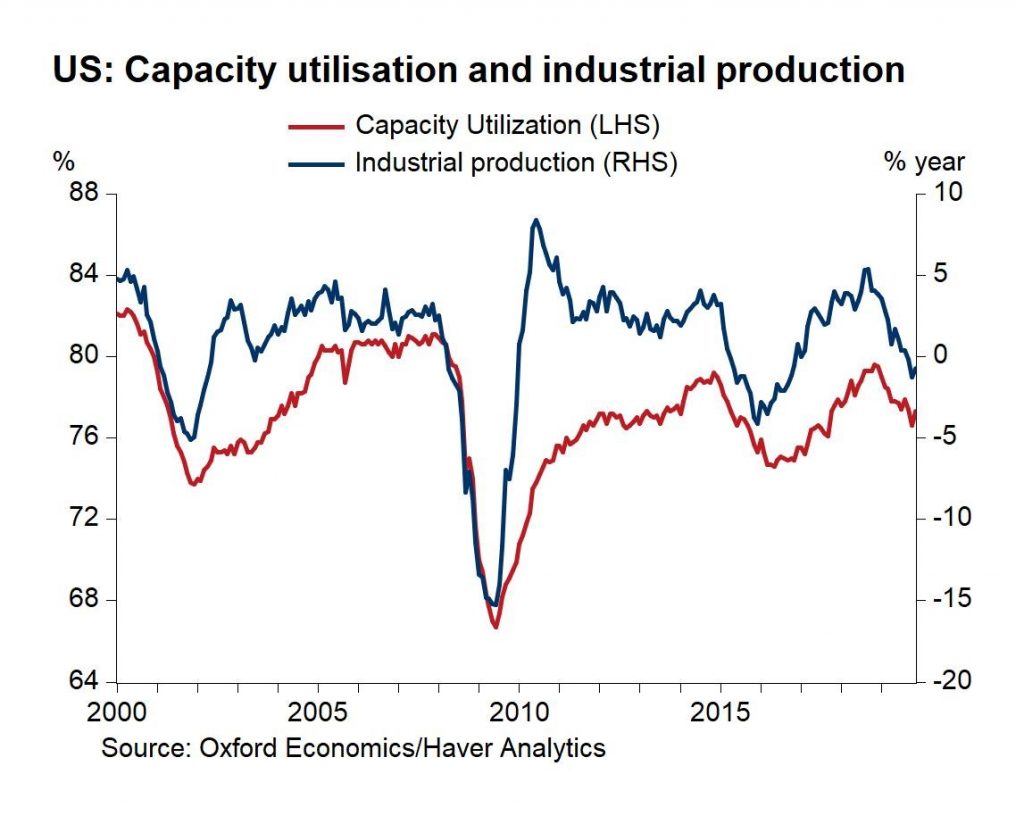
As you can see from the chart below, the capacity to utilization rate, which had its November rate revised 0.1% lower, increased from 76.6% to 77.3% which missed estimates by a tick. Even with the improvement caused by the GM strike ending, both industrial production and manufacturing production had yearly growth of -0.8%.
Good news is the comp was about the same for manufacturing and was harder for industrial production. Yearly industrial production growth rose from 2% to 2.5% in November 2018. Both comps will get easier in the coming months since manufacturing was weak in 2019.
Just on easier comps alone, we should see positive growth next year. Adding in the global manufacturing acceleration, makes the outlook even better. As the chart earlier in this article showed, the global manufacturing PMI is set to have positive yearly growth.
Mining production growth was 2% which was down from 3% in October. You’d expect to see higher mining growth because oil prices now have an easier comp. However, mining production still has a tough comp as growth was 13.1% last November. Starting in February, the comps will be easier.
Remember, the fact that mining production isn’t cratering like it did from 2015-17 explains why this manufacturing slowdown isn’t as deep as the last one. It’s certainly wider though. Utilities production was down 4.1%. It had a very tough comp which was 6.1%. Monthly growth was 2.9% because it had a very easy comp of -2.4%.
Amazing Housing Starts Data
The housing market index spiked in December which led me to say the housing market would improve then. November housing starts and permits data was so great, it makes one wonder how strong it can be next month. There’s no doubt real residential investment growth will be strong in Q4. It still won’t make up for the weakness in consumption growth that the November retail sales report suggested might exist.
Personally, I’m still banking on a strong consumer. But I’ll need to wait for the November PCE report and the December retail sales report for support on that thesis. Redbook same store sales report from the week of December 17th showed growth fell from 5% to 4.6%. But remember it’s facing ridiculously strong comps which didn’t end up accurately predicting the weak retail sales growth last December.
Housing data has weak comps in Q4, but this housing starts report was good on its own. Housing starts increased from 1.323 million to 1.365 million which beat estimates for 1.34 million. The previous report was revised up from 1.314 million. This was the 2nd best reading of this expansion.
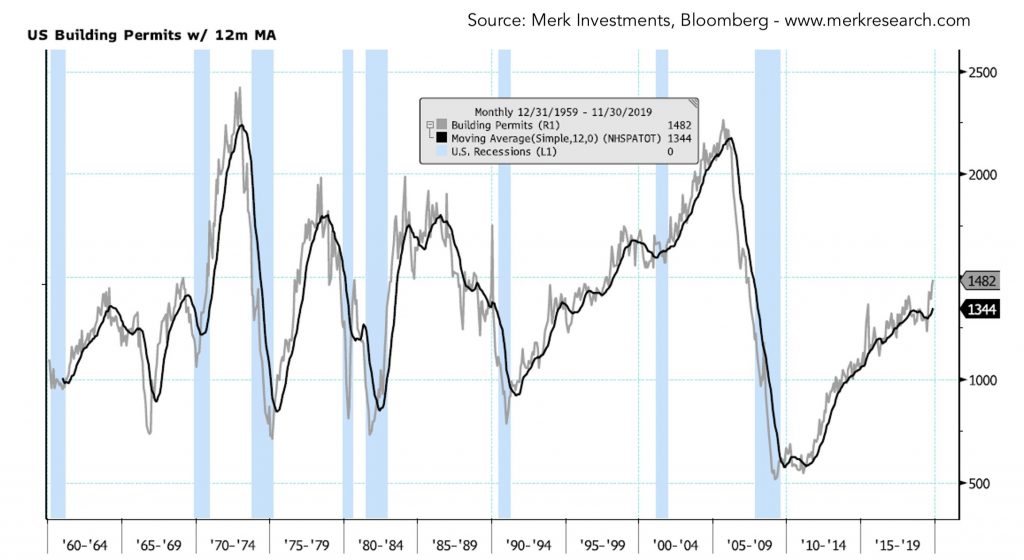
There is almost no chance of a recession in the near term when starts are at their cycle high. Permits reading was even better as permits increased from 1.461 million to 1.482 million which beat estimates for 1.41 million and the high end of the estimate range which was 1.45 million.
As you can see in the chart below, permits also lead the economy. They don’t peak right before recessions. We’re at the least 18 months away from a recession. The only recession that occurred near a peak was the double dip recession in the early 1980s.
Clearly, this isn’t a double dip recession as this is the longest expansion since the 1800s. This isn’t close to the best housing market in the past 20 years. But it is doing better than has been in the past few quarters.
Conclusion
Fund managers are optimistic on the economy. Industrial production report showed some improvement. But that was helped by the ending of the GM strike. Let’s see if yearly growth can go positive with the easier comps next year.
Housing starts and permits were amazing. No need to mention yearly growth because there’s no need to compare the housing market with the weakness of Q4 2018.
Permits hit a new cycle high and starts were the 2nd highest in this expansion. I think real residential investment growth will be strong in Q1 2020. Permits lead starts by a few months.