Big Improvement In Housing Market Index
Housing market index increased from 71 to 76 in December which beat estimates for 70. The original November report was revised from 70. As you can see from the chart below, this was the best reading in 20 years. It’s quite interesting to see such a high level.
It literally means home builders are more optimistic than they were at the height of the housing bubble in the early to mid 2000s. The housing market is improving because of the decline in rates. Average 30 year fixed mortgage rate was 3.73% in the week of December 12th. That’s slightly above the bottom of 3.49% in September and way below the top of 4.94% in November 2018.

After a 7 quarter decline in real residential investment, growth was positive in Q3 and should be positive in Q4 as well. There’s definitely improvement here. However, let’s not get too ahead of ourselves. Permits and housing starts as a percentage of the population are way below previous cycle peaks. There’s a 99.9% chance that continued in December. It’s best to say the December housing market will be better than where it has been in the past few quarters, but not better than the 2000s.
Specifically, the single family present sales index increased from 77 to 84. I’d much rather see strength in the current index in a report that has almost unbelievable strength. This report supports the already strong case that real residential investment growth will be positive in Q4. The index measuring expected sales in the next 6 months rose 1 point to 79.
Finally, the traffic index, which has been relatively weak in the past couple years, increased 4 points to 58. This signals the first time housing market improved. This index first hit 50 this year in August. It was 43 in December 2018 and started the year at 44. It has come a long way.
It’s very interesting that 2 of the 4 regions saw declines even though there was a big jump in the overall index. Northeast and the West fell from 64 and 85 to 58 and 83. This just shows how small the housing market is in the Northeast. The index’s sharp decline didn’t do much.
South, which is the biggest market, saw its index increase 2 points to 77. There was a huge 15 point jump in the Midwest from 58 to 73. It’s very unusual to see an index move that much. Usually, these indexes move a few points at most. I’m not sure what happened in the Midwest in December.
Modest Empire Fed Manufacturing Report
With the improved November Markit report and falling ISM PMI, everyone wants to know the true direction of the manufacturing sector. December Empire Fed report didn’t give us conclusive evidence either way as the index rose slightly from 2.9 to 3.5 which slightly missed estimates for 4.
We will get much more information in the November industrial production report that’s released on Tuesday. But for now let’s look at the Empire Fed and Markit flash composite readings.
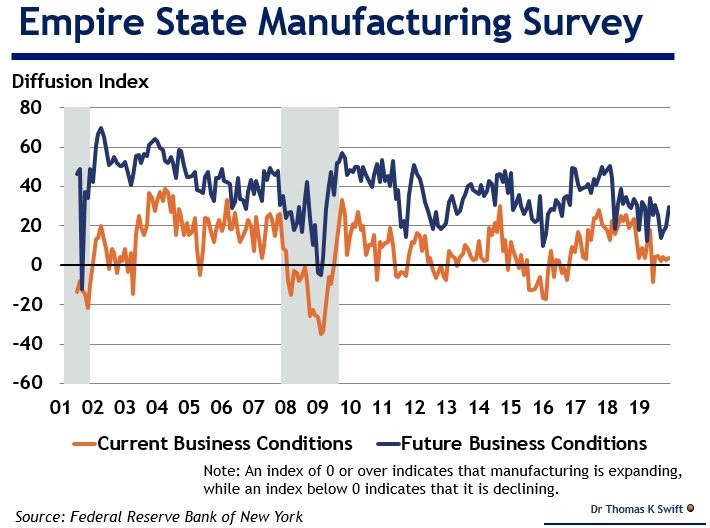
Empire Fed new orders and shipments indexes were down 2.9 points to 2.6 and up 3.1 points to 11.9. There wasn’t much change in the current reading. As you can see from the chart above, the 6 month forward looking index increased sharply. It was up from 19.4 to 29.8. That’s the best reading since July. Even though firms were optimistic in July, that ended up leading to the weakness we’ve seen in the fall, meaning it’s not always accurate.
It’s difficult for manufacturing firms to forecast the future as this is a highly cyclical sector. And it’s no surprise there were a few strong readings within the expectations category. New orders index was up 11.4 points to 35.6 and the shipments index was up 5.4 points to 29.8. Tech spending and capex indexes were very strong. They increased from 15.1 and 19.2 to 27.5 and 26.1. This was one of the best tech readings in the past 5 years.
Another Nice Improvement In The Markit PMI
Markit reports have been mostly positive in the past few months especially on the manufacturing sector. December flash reading showed more of the same with an additional bump in the service sector. The reading supports the narrative that the slowdown is ending.
Specifically, the composite index increased to 52.2 from 52 which is a 5 month high. Manufacturing PMI and the manufacturing output indexes fell from 52.6 and 53.7 to 52.6 and 52.4. Services index rose from 51.6 to 52.2 which is a 5 month high. I’ve been wondering why the services PMI has been below the manufacturing PMI. That gap narrowed to just 0.3. I expect both to move higher in 1H 2020 and the services index to get back above the manufacturing index.
Rate of new business in the service sector improved, but was still muted. This was the quickest rate of new order growth in 5 months. Export orders increased after falling for 4 months. Employment increased for the 2nd straight month.
Output expectations for the next year increased to the highest level since June. On the manufacturing side, output and new orders were up, but not by as much as November. Employment rose. Just like in services, the 1 year outlook was the best since June. Prices paid were up the most since March.
The comment section of the report stated, “The surveys bring welcome signs of the economy continuing to regain growth momentum as 2019 draws to a close, with the outlook also brightening to fuel hopes of a strong start to 2020.”
This report is consistent with 1.5% GDP growth. That’s near the median estimate which is 1.8%. I’m slightly more optimistic than Markit. Markit anticipates “above average potential” 2020 GDP growth which it predicts to be 2.2%. That’s probably correct as the economy will recover next year from the weakness in 2H 2019.