Another Solid Redbook Retail Sales Report
Redbook retail sales report showed yearly growth fell 1 point from 6.4% to 5.4% in the week of September 14th. This is still a solid reading. Growth decline if the August retail would have been more concerning if the sales report had come in weak. Since it was very strong, I don’t see any reason to worry. Any Redbook sales report with growth in the mid single digits is good enough to ward off concerns about the tariffs hurting the consumer.
Retail sales report is more valuable in determining the small rate of change movements throughout the year. Control group sales reading goes directly into the GDP report, making it very important. There is no concern with Q3 consumer spending growth. Only reason to focus on it so much is because every other category is concerning.
Another Great Housing Market Reading
The housing market could be hurt by rising yields, but there needs to be a bigger increase than what we saw last week. It needs to be sustained as well. The minute rates increase, refinancing will fall, but quick changes won’t hurt home buying much. I’m not sure if the September housing market index survey includes some data after the spike in rates. It may not because it takes at least a few days to calculate and present the data.
Based on the strong reading, I don’t think it does. If some of the survey was done last week, homebuilders clearly didn’t react to the change in rates as the index increased from 67 to 68 in September after being revised 1 point higher in August. This beat the consensus of 66. It was the best reading since October 2018.
The index’s increase was driven by present sales which increased from 73 to 75 which is the best reading in over 1 year. 6 month expectations index fell 1 point to 70 which is still strong. Prospective buyers index was flat at 50 which signals the first time buyers’ market still isn’t improving. Last time it was above 50 was October 2018.
Looking at the data on a regional basis, the Northeast had the biggest improvement as it was up 8 points to 65. It went from being the worst region to the 3rd best. Midwest was the worst as it was steady at 59. South, which is the biggest region, was up 3 points to 72. There shouldn’t a big hurricane related impact to the housing market. Finally, the West, which had the best reading, improved 1 point to 76.
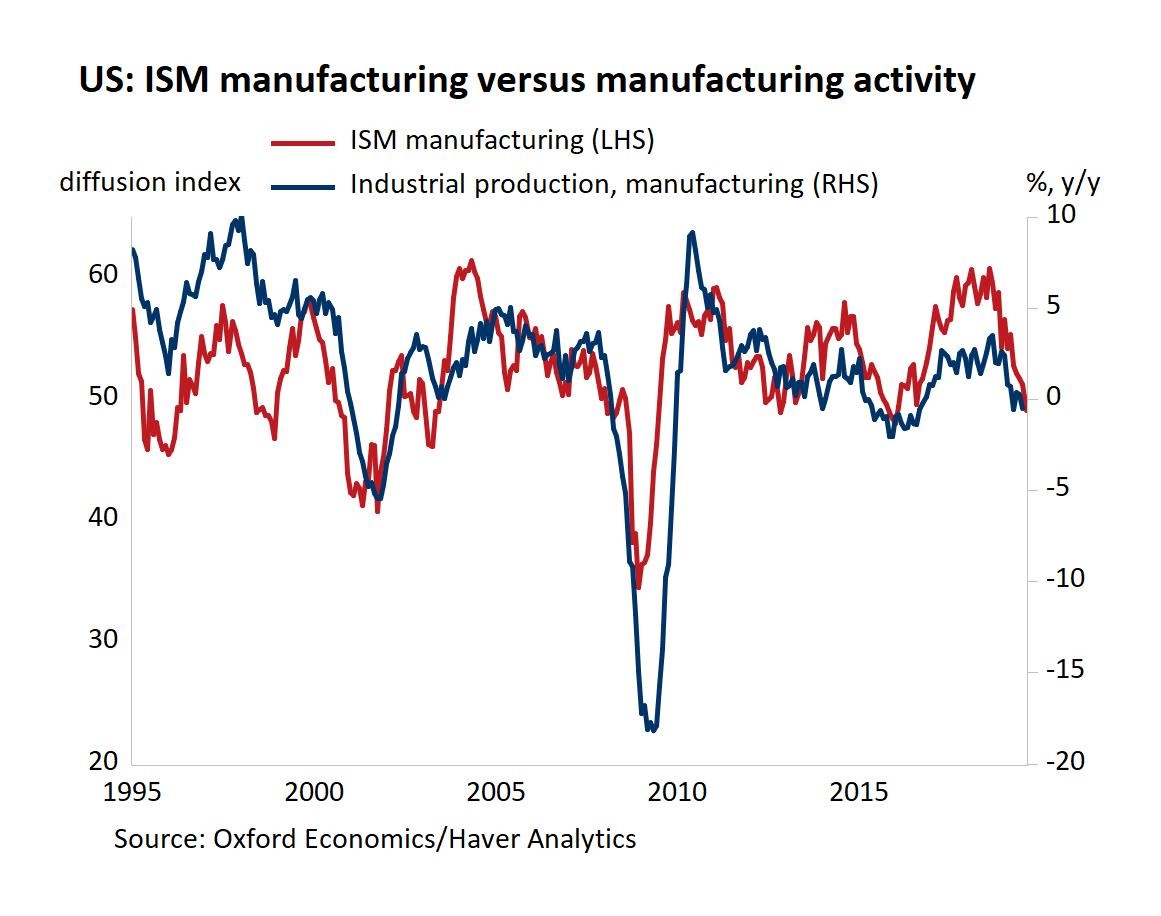
Industrial Production Beats Estimates, But Downtrend Continues
August industrial production report beat estimates on a monthly basis, but yearly growth showed the weakness still remained. At least there wasn’t a big deceleration. It’s still a modest manufacturing recession. Specifically, monthly industrial production growth was 0.6% which tripled the consensus. July’s reading was revised up 0.1% to -0.1%. That easy comp explains why monthly growth was stronger than early growth.
As you can see from the chart below, yearly growth fell from 0.5% to 0.4%. That’s the weakest growth since January 2017. The trough in the last manufacturing recession was -4.1% in December 2015.
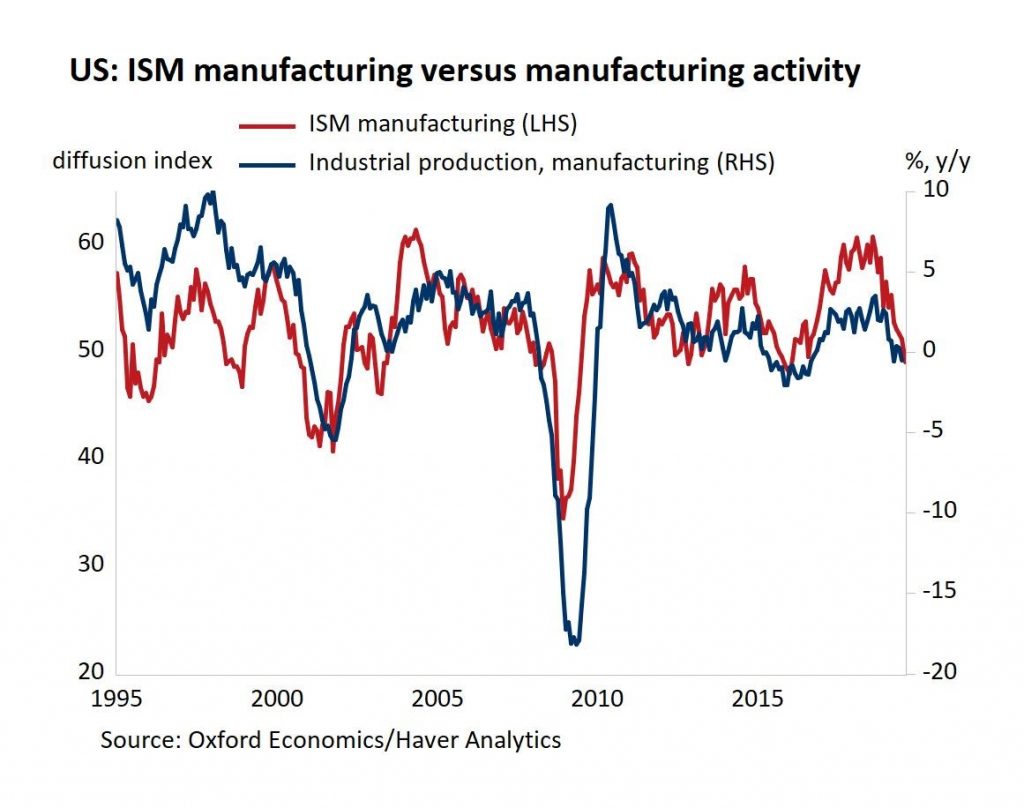
Monthly manufacturing growth was 0.5% which beat estimates for 0.1% and July’s reading of -0.4%. Just like industrial production, yearly manufacturing growth was below monthly growth. The chart shows yearly growth improved from -0.5% to -0.4%. This category shows significant improvement when you look at the 2 year stack.
2 year stack improved from 2.1% to 2.9%. It’s good to see higher yearly growth even though the comp got tougher. The comp will peak next month. Then comps will get easier. We will see the true depth of this manufacturing recession in the yearly growth readings later this year. So far, it hasn’t been that bad. Yearly growth low in 2015 was -2%.
Mining saw a big 1.4% bounce in monthly growth. Growth rebounded after the disruption caused by hurricane Barry in July. However, yearly growth still fell from 5.9% to 5.1%. Low likelihood of this decline getting near the depth of the 2015-2016 slowdown is why this industrial production slowdown will need to be much broader to get to the depths of the last slowdown.
A big spike in oil prices on Monday could help mining production. It depends on if it lasts. Regardless of whether it does, oil price growth should be positive on a yearly basis starting in November which will limit the yearly decline in mining production. There will be yearly weakness in September and October though. Yearly growth should get to the low single digits.
Capacity to utilization rate in this report actually improved 0.4% to 77.9% which beat estimates for 77.6%. Capacity is not close to constraint. This was the biggest monthly increase since August 2018.
Beat Easy Estimates
As you can see from the chart below, the Citi Global surprise index never cratered as low as the 2012 trough when Europe fell into a recession, but its recent streak of negativity was the longest since at least 2003. 361 trading days below 0 is longer than the 236 day steak in the global financial crisis of 2008.
Lengthy negative streaks tell us that weak data points persisted longer than most analysts projected. You would think analysts would lower their expectations when the data missed the consensus. Finally, they lowered them enough in September so the Citi Surprise index is no longer negative. This doesn’t mean the global economy is recovering though. It’s just food for thought.

Conclusion
Solid Redbook sales growth shows the consumer isn’t slowing down its spending growth because of the tariffs. Industrial production report showed us the manufacturing recession isn’t getting worse. Housing Market index was very solid as the Northeast showed decent improvement.
Global Citi surprise index finally reached positive territory, ending its longest negative streak in at least 16 years. I don’t see evidence of a global recovery yet although some are predicting one next spring. Chinese growth would need to stop falling for there to be an improvement in global growth in 2020.