Windshield Wiper Thursday
The stock market was like a windshield wiper on Thursday because it moved back and forth. Even though the action wasn’t as sharp as we’ve seen in previous days, it was significant, because if the market would have closed at the low of the day, it would have made a new correction low. Because of the 0.7% rally in the last 2 hours of the trading session, the S&P 500 avoided deepening this correction. It closed up 0.25%. However, the Nasdaq fell 9 basis points, and the Russell 2000 fell 0.4%.
Correction Stats
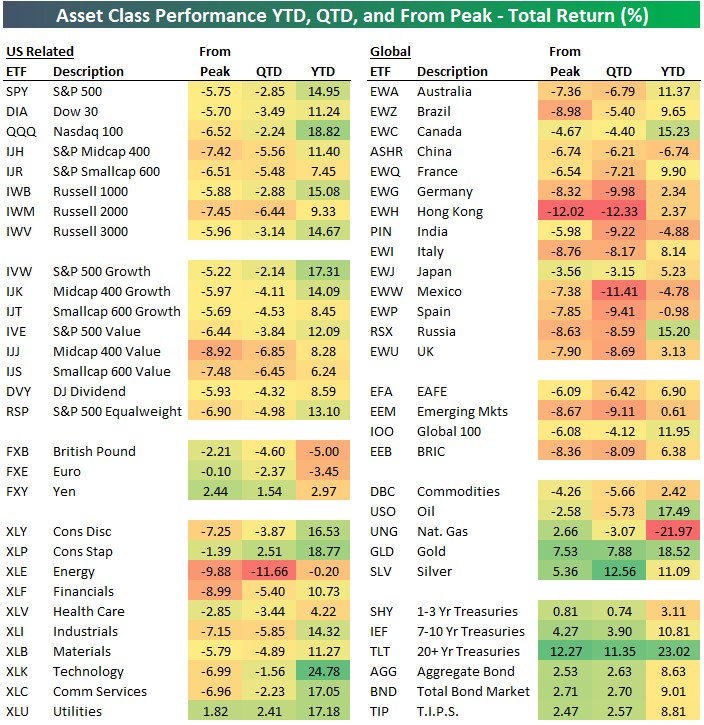
The tables below detail the updated stats from this correction across markets. This certainly hasn’t been a terrible correction for American stocks, but there are a few pockets of weakness. The worst American index is midcap value which has fallen 8.92%. That’s logical because the banks and energy stocks are heavily weighted in the value category. The banks are a big reason why the Russell 2000 fell 7.45%. Energy is down 9.88% and the financials are down 8.99%.
The best sector since July 26th is the utilities which is up 1.82% principally because yields are down significantly. The utilities are up 17.18% year to date which is now significantly above the S&P 500’s return of 14.95%. The TLT is the best performer across markets as it is up 12.27% in this period. It’s up a phenomenal 23.02% year to date. With the TLT’s 14 day RSI at 84.99, it is the most overbought since 2003. This run is likely not going to continue in the near term. It has gotten insane. It’s no surprise that the Hong Kong market is on this list as the worst performer. It is down 12.02% in this period because of the protests. The obvious market that is left off is Argentina which has seen its stock index implode because of the recent presidential election.
Thursday’s Action Detailed
The VIX fell 4.16% to 21.18. It fell despite the back and forth action probably because it started the day relatively high. You need a solid pullback to support the VIX when it’s in the low 20s. On the other hand, the CNN fear and greed index fell 2 points to 19 which is extreme greed. It signals the market is very oversold. Risk on action might resume shortly. Every single category is in extreme fear or fear. It’s not as low as it was late last year or early last year which makes sense because this has still been a small pullback.
Thursday was the first day of the week where every sector didn’t go in the same direction. The best sectors were the utilities, real estate, and consumer staples, which increased 1.26%, 1.34%, and 1.51%. The consumer staples sector was helped by Wal-Mart which reported great earnings which I will review later in this article. The worst sectors were the industrials and energy which fell 0.23% and 0.52%. The July industrial production report missed estimates.
Political Uncertainty Has Catalyzed This Correction
With such a great retail sales report and solid jobless claims data, what is driving the correction? It’s a combination of a cyclically weak manufacturing sector and political uncertainty. My non-consensus opinion is that the risk of a recession in the next year is overblown. The latest retail sales report makes it more likely Q3 GDP growth will be at or above 2%. The current median estimate is 2%.
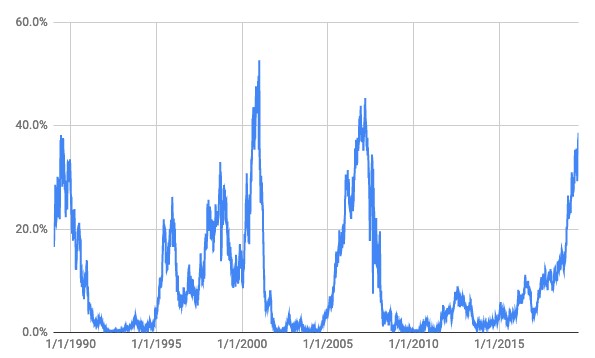
As you can see from the chart below, the monthly global economic policy uncertainty index recently hit its highest point since at least 1998. The tariffs, Hong Kong protests, Argentinian election, and US presidential election are causing uncertainty. The Democratic primary is now a 3 horse race between Biden, Warren, and Sanders. Biden is at 31%, Warren is at 17.3%, and Sanders is at 16% in the average of the 6 most recent polls. The next debate is on September 12th. It will be interesting because unlike the last 2 which had 20 candidates qualify, there are currently only 9 candidates that meet the threshold to debate. The top candidates will likely finally all debate face to face on the same night.

NY Fed’s Model Sees A 39% Chance Of A Recession
I don’t think the situation is as simple as the NY Fed’s model lays it out, but I am always interested to see its latest results. The chart below shows the model now has the odds of a recession in the next year at 39%. This has spurred widespread bearishness. People are looking at the yield curve and not at the strong consumer. Sentiment is terrible. That’s what makes this a great buying opportunity for stocks and a great selling opportunity for treasuries. Treasuries can barely get more overbought than they are now.
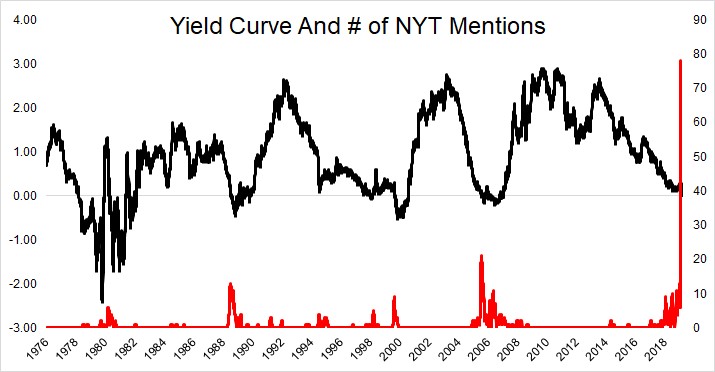
To support my point that the yield curve is all everyone is talking about, as you can see from the chart below, the NY Times has mentioned the yield curve now much more than any previous cycle. That’s not enough to prove the yield curve won’t be right this cycle. It just shows us what the consensus believes. There is a lot of money to be made if the yield curve is wrong about a recession next year. I think there might not be a recession because the consumer isn’t leveraged. If the consumer is strong in 2020, there likely won’t be a recession.
Solid Wal-Mart Earnings
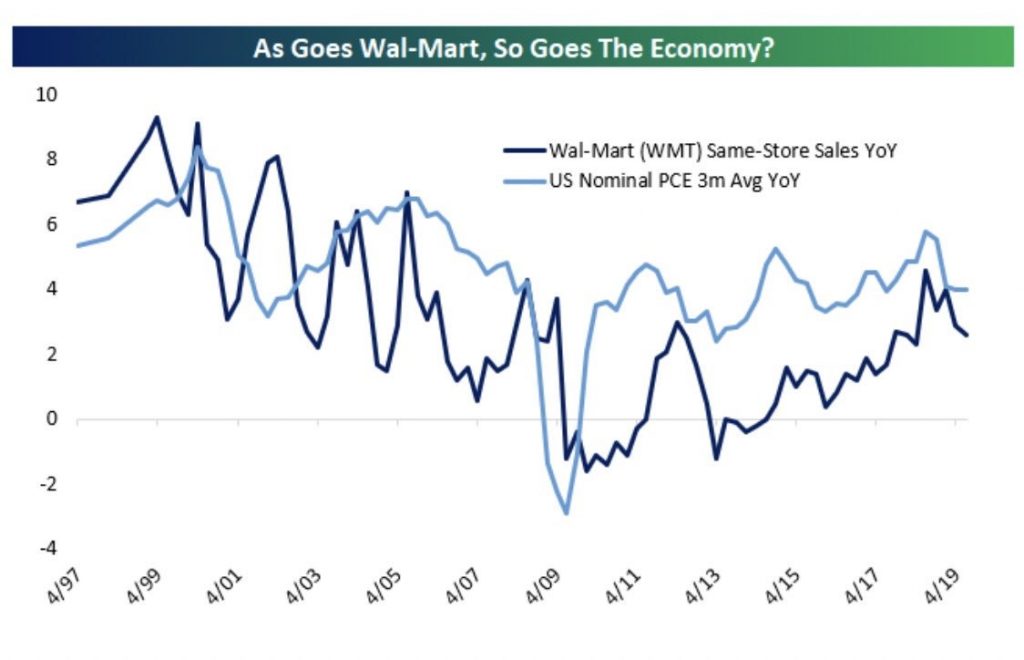
Wal-Mart stock rose 6.09% because the firm beat earnings, revenues, and same store sales estimates. EPS was $1.27 which beat estimates by 5 cents. Revenues were $130.38 billion which beat estimates by $270 million. Same store sales growth was 2.8% which beat estimates for 2.1%. As you can see from the chart below, same store sales growth has recently been trending downward which is a negative signal for PCE. However, it’s still relatively solid compared to the rest of this expansion.
Transactions were up 0.6% and the average ticket was up 2.2%. Online sales growth was 37% and the firm is calling for 35% growth for 2019. That is consistent with the 16% online sales growth in the July retail sales report. Wal-Mart’s next day delivery reaches 75% of Americans. 2,700 stores have pickup for online grocery orders. 1,100 stores have same day grocery delivery.