Pending Home Sales - The Biggest Week Of 2019
Before getting into Pending Home Sales let's review the markets. The week to start the month of August was probably the most jam-packed week of the year. Especially in terms of news events and action in markets.
We’ve had earnings reports, a new tariff announcement, and a Fed meeting. Also, we've had many economic reports, and market volatility. Therefore, I am behind on parsing through all the news. That’s why I’m reviewing data from a few days ago.
Pending Home Sales Index Improves
Pending Home Sales - We’ve mostly seen weak housing data this year. That’s why the record percentage of consumers looking to buy a new house in the Conference Board consumer confidence report was surprising.
It turned out to be in line with the June Pending Home sales report which was surprisingly good. No, it didn’t hit a record high. But monthly growth was 2.8% which beat estimates for 0.5%. And the high end of the estimate range which was 1.5%.
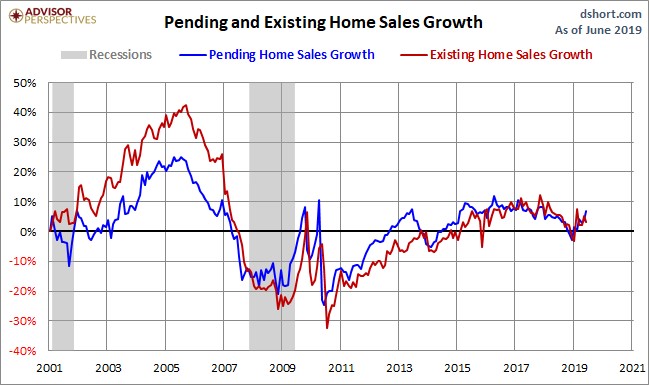
On the negative side, monthly growth in May was revised down from 1.1% to 0.5%. The overall index increased from 105.4 to 108.3. As you can see from the chart below, the yearly growth rates of pending and existing home sales have rebounded since the end of 2018. Comps will get easier and growth will improve in the next few months.
It’s no surprise that there were solid numbers throughout the regions
Pending Home Sales - Headline index was solid. West had 5.4% monthly growth and 2.5% yearly growth as its index was 96.8. That’s the 2nd lowest index, but the highest monthly growth.
As you know, Seattle is starting to see weakness (1.4% decline). But Las Vegas and Phoenix are the hottest cities in the country in terms of price growth. They were 6.4% and 5.7% in May.
Midwest had 3.3% monthly growth and 1.7% yearly growth as its index was 103.6. This region has the most affordable housing. Issue is millennials don’t want to move across state lines to these affordable areas. They prefer expensive cities.
That’s why cities have gotten so expensive in the first place. South, which is the largest housing market, saw 1.3% monthly growth and 1.4% annual growth. Its index was 125.7. That’s the highest index. Northeast had its index rise 2.7% monthly and 0.9% yearly to 94.5 which is the lowest reading.
Overall, these positive readings spell good news for the future housing market, potentially allowing Q3 to break the 6 quarter trend of negative real residential investment growth.
Pending Home Sales - MBA Applications Index Falls
Ironically, as we see some strong housing data, the MBA Applications report, which has been strong this year, showed some weakness. Composite index fell 1.4% weekly after falling 1.9% weekly.
Refinance index was down 0.1% after falling 2%. The average 30 year fixed mortgage rate is 3.75% which is 2 basis points above the recent low. Purchase index was down 3% weekly after falling 2%. That pushed the yearly growth rate down to 6% which is still solidly positive.
Q2 Employment Cost Index
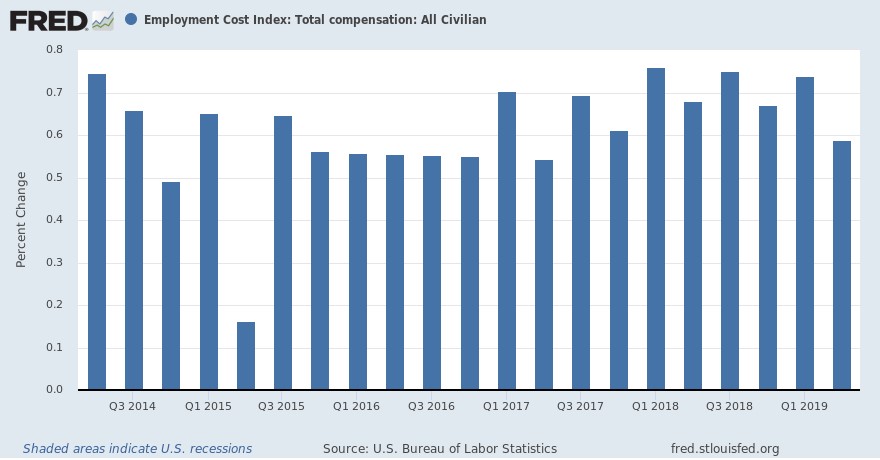
Pending Home Sales - It’s interesting to review the Employment Cost Index since the wages and salaries calculation was just revised higher. Its growth is plateauing just like hourly wage growth in the BLS report. On a quarter over quarter basis, Q2 growth was 0.6% which missed estimates and last quarter’s reading of 0.7%.
As you can see from the chart below, quarterly growth has stayed within the range of 0.54% to 0.76% since Q3 2015. On a yearly basis, growth was 2.7% which missed estimates and the prior quarter’s reading which both were 2.8%. Benefits growth fell 0.2% to 0.5% quarterly and 2.3% yearly. Wages and salaries growth was steady at 0.7% quarterly and 2.9% yearly.
Pending Home Sales - Solid July ADP Report: Improved Small Business Job Creation
BLS report is already out, but it’s still valuable to review the ADP report especially since it showed just 8,000 more private sector jobs created than the BLS reading. ADP report showed there were 156,000 private sector jobs created which beat estimates by 1,000. June’s report was revised up by 10,000 to 112,000.
Once again, the ADP report showed the bigger the company, the more jobs were created. However, this time there were jobs created by small businesses.
In June, there were -23,000 jobs created by small firms. That was the 2nd straight negative reading. In July, there were 11,000 jobs created. More than 100% of those jobs were created by ‘other small firms’ as ‘very small firms’ with 1-19 employees created -18,000 jobs. ‘Other small firms’, which have 20-49 employees, created 29,000 jobs.
Weakness in ‘very small firms’ was centered in the service providing sector
Pending Home Sales - There were 14,000 jobs lost. It was exactly the opposite for ‘other small firms’ as they created 30,000 service providing jobs.
Midsized businesses added 67,000 jobs and large firms added 78,000 jobs. It’s no surprise the service sector added most of the jobs since manufacturing is in a slowdown.
Goods producing firms created 9,000 jobs. In the Markit manufacturing report, which I will review in a future article, the employment reading was the weakest since 2013. The manufacturing industry created 1,000 jobs.
June construction report showed weakness, but the ADP report actually showed it added 15,000 jobs in July. There may be too many workers for the amount of spending that’s happening. Service sector added 146,000 jobs.
As usual, technology created the least amount of jobs and professional & business and education & health created the most. Tech created -5,000 jobs. Professional & business and education & health created 44,000 and 37,000 jobs.
Pending Home Sales - Conclusion
The housing market might be starting to rebound if the pending home sales report is any indicator of how it will do in the next few months. July ADP report was very accurate in predicting the BLS report.
Both showed there was slightly more jobs created than population growth. Modest slowdown in yearly job creation growth is either being caused by cyclical weakness or the fact that the labor market is nearly full. My bet is on the cyclical slowdown.