Weak New Home Sales - March 2020 Recession Signal
Weak New Home Sales may signal a recession. The May new home sales report wasn’t good. A negative revision to the March reading means the cycle high was November 2017. You can see this from the chart below.
Median new home sales peak occurs 28 months before the next recession. Last month, the revision to the March 2019 report put it above the November 2017 reading. Now it’s at 705,000 and the November reading is 10,000 higher.
This is far from a guarantee that there will be a recession by early next year. I’d like to see a greater decline in the next few months before being comfortable with saying this indicator is predicting a recession.
That recessionary weakness was present in Q4 when there were 557,000 new homes sold in October and 564,000 sold in December. However, sales have since rebounded.
Now let’s get to the details of the May reading.
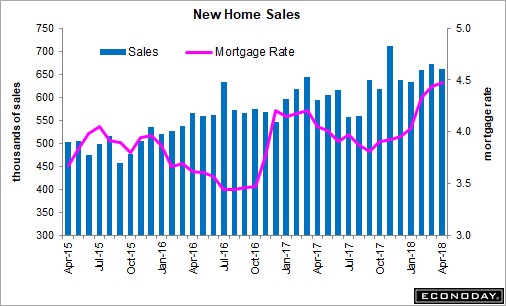
Weak New Home Sales - New home sales fell from 679,000 to 626,000, missing estimates for 680,000 and the low end of the consensus range which was 649,000. 3 month moving average fell 14,000 to 670,000 which was the first decline this year.
Decline in rates helped sales recover from the Q4 trough. But the recent 2 months of declines is disconcerting. Especially with the weakness in prices and rates making housing more affordable.
New home sales prices were down 8.1% monthly and 2.7% yearly to $308,000. The 2.7% decline is in line with the 3.7% decline in sales.
Supply increased 0.3% to 333,000. Because sales fell, the monthly supply increased from 5.9 months to 6.4 months. When you review the monthly data from each region, it’s very obvious that the South is very important.
Weak New Home Sales - If the housing market is very strong in the South, it can push up the whole market.
However, its modest improvement in May wasn’t enough. Specifically, new home sales in the Northeast fell 6,000 to 28,000. They fell very sharply in the West. They were down from 195,000 to 125,000.
Sales in the Midwest and the South increased 5,000 and 18,000 to 84,000 and 389,000. South’s share of new home sales increased from 54.6% to 62.1%.
FHFA Home Price Index
Weak New Home Sales - FHFA home price index and the Case Shiller home price index showed some differing results. I’ll review both and explain what they mean.
First, the April FHFA home price index showed monthly growth of 0.4% which beat the consensus of 0.2% and the prior reading of 0.1%. It’s very unusual to see price growth hitting the high end of the estimate range given how weak home price growth has been.
Yearly price growth improved from 5% to 5.2%. It’s still below last year’s pace when it was between 6% and 7%, but that’s not a surprise because homes became unaffordable last year according to consumer surveys. Mid-Atlantic had the weakest price growth at 4%. Mountain states had the highest price growth (7.8%) as Denver has been strong this cycle.
Weaker Case Shiller Home Price Index
Weak New Home Sales - Case Shiller index didn’t show the improvement seen in the FHFA index. The 20 city seasonally adjusted monthly price growth was 0% which missed estimates for 0.2%.
March reading was revised from 0.1% to 0.3%. Non-seasonally adjusted price growth for the 20 city index was stronger as it was 0.8% which beat estimates for 0.5% and the prior reading which was 0.7%.
Finally, as you can see from the chart below, non-seasonally adjusted yearly growth in the 20 city index fell from 2.6% to 2.5%, missing estimates for 2.6%. That’s a 7 year low. March reading was revised from 2.7%.

On a national basis, yearly price growth fell from 3.7% to 3.5%. That's the lowest growth rate since September 2012. Seattle’s price growth has gone through a massive collapse in the past few months. Its yearly growth of 0% was the worst out of all 20 cities. Growth peaked at 13.6% in May 2018.
Weak New Home Sales - It’s very obvious growth will fall deeply negative soon.
Weak New Home Sales - It’s just a matter of whether this means the overall housing market is in trouble or if this is limited to Seattle. I don’t think the situation for the overall market will get as bad as last cycle, but there will be some cities that underperform.
Cities most likely to be weak are the ones with the strongest growth earlier in the cycle. Cities like New York and Washington D.C. won’t see major crashes in growth like Seattle. They didn’t have high growth this cycle.
In April, New York’s growth rate was 2.1%; it peaked at 5.7% in February 2018. I don’t see its growth rate going negative unless the economy really craters.
Similarly, Washington D.C. had 2.6% growth.
Weak New Home Sales - It hasn’t even had a recent peak as growth has been below 4% since mid-2014. Las Vegas is an example of a hot market that’s cooling off except its growth rate is still high. It had the highest growth rate out of 20 cities.
In April, it fell to 7.1%; it peaked at 13.8% in August 2018. Given the upcoming tough comparisons, I can see its growth rate easily falling below 5% this summer. San Diego was the 19th best city as its yearly growth was 0.8%.
Weak New Home Sales - Takeaway
Regardless of what the FHFA survey shows, I believe price growth has fallen like the Case Shiller index shows. The housing market didn’t reach the bubble levels of the early 2000s. But cities like Seattle got overheated and are paying the price now.
If interest rates were to spike and the economy were to weaken, we would have a terrible housing market, but it probably wouldn’t be as bad as 2008. There weren’t teaser rate mortgages with no documentation this cycle.
I don’t see rates rising, but the economy could be weak in Q3. On the positive side, even after these weak housing reports, the Atlanta Fed’s estimate for real residential investment growth is 0.4%. That would end the 5 quarter losing streak.