S&P 500 Stocks - Extreme Rally Continues
Investors keep saying the stock market’s parabolic start to the year won’t continue. But it keeps proving us wrong. Personally, I want to be bullish because the economic data doesn’t signal a recession is coming But the stock market is overbought and getting expensive.
As you can see from the chart below, as of February 12th, the S&P 500 has been up 72.4% of the days this year. This is by far better than any other year.
It's almost impossible for this to continue. It will at least fall to the low 60s if the past 90 years of data means anything.

S&P 500 Stocks - Too Expensive
The S&P 500 is up 9.82% year to date. I don’t think it will end the year higher than where it is now even though I don’t see a recession coming.
That’s what it’s like to be modestly optimistic on the economy and cautious on stocks. The S&P 500 is up 17.1% since the bottom on Christmas Eve. It is only down 6.1% from the record high last September.
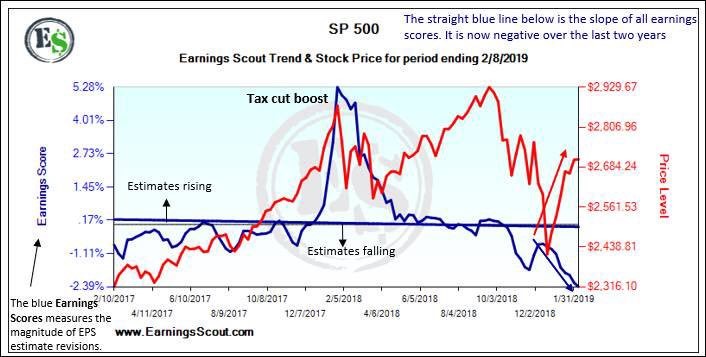
Last year stocks underperformed earnings growth by far. This year they are outperforming expected earnings growth of 5%. The question is how much stocks are going to outperform earnings growth this year.
As you can see from the chart below, earnings estimates have cratered while stocks have exploded higher.
A similar set up took place prior to 2000 and 2008. The difference here is earnings growth is impacted by very tough comparisons. There also isn’t a recession coming soon.
To be clear, it’s still not great to see Q1 2019 EPS estimates fall from 5.54% at the start of the year, to just 1.33% now. The only strong growth will be in Q4 as estimates are for 11.29% growth because of the much easier comparisons.
S&P 500 Stocks - Calculating How Overbought Stocks Are
On Wednesday S&P 500 was up 0.3%, Nasdaq was up 8 basis points, and Russell 2000 was up 0.31%.
Only the utilities and communication services sectors fell as they were down 0.31% and 0.1%. The best 2 sectors were energy and industrials which were up 1.29% and 0.63%.
This is yet again another day the industrials beat the market. The industrials sector is up 24.36% from the Christmas Eve low and is up 15.91% year to date. This sector loves the January Markit manufacturing PMI.
CNN fear and greed index stayed at 67 which is fear. The 14 day RSI increased to 66.22. One or two more up days will send it above the 70 threshold which signals stocks are overbought. It peaked at 87.03 on January 26th, 2018.
S&P 500 Stocks - That’s the most overbought stocks got since at least 1993.
I wouldn’t be surprised if that level is never hit again in the next 10 years.
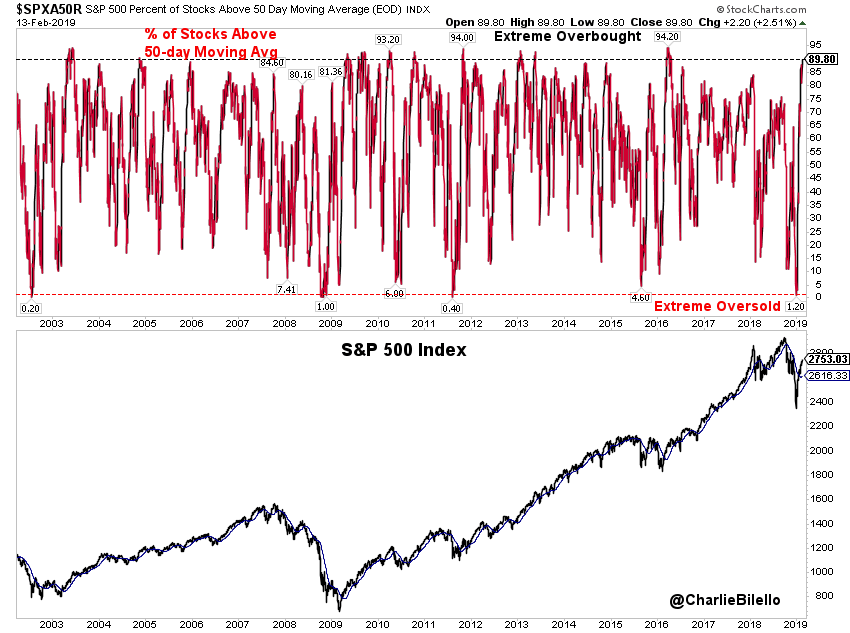
As you can see from the chart below, 89.8% of stocks in the S&P 500 are above their 50 day moving average. This is much higher than the peak in early 2018 even though stocks had the highest 14 day RSI in over 20 years.
Clearly, that rally had weaker breadth than this one. Since the financial crisis, there have only been a few times where a higher percentage of stocks were above their 50 day moving average.
The cycle peak and the highest level since 2003 was in early 2016. 94.2% of stocks were above their 50 day moving average. This is a similar situation as the spring of 2016 as stocks are recovering from a recession scare. It would be amazing to see a similar economic recovery to mid-2016 to mid-2018.
There won’t be tax cuts to help the economy this time.
S&P 500 Stocks - Earnings Recession Doesn’t Mean An Economic Recession Is Coming
Earnings recessions usually don’t mean an economic recession is coming.
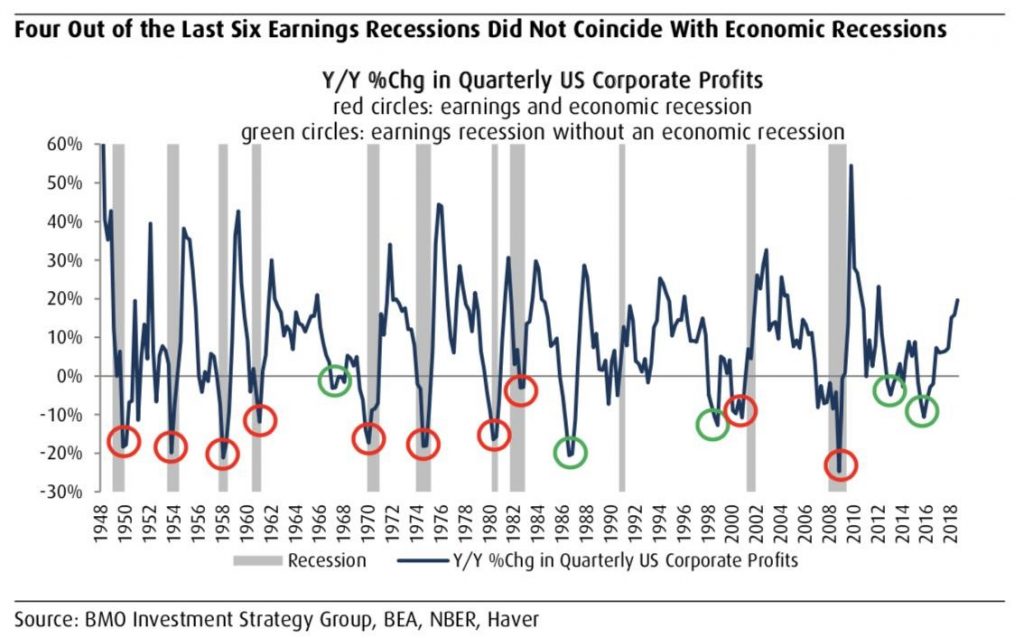
As you can see from the chart below, 4 out of the past 6 earnings recessions didn’t coincide with an economic recession. Earnings recession can indicate there is a slowdown or a recession.
Since there are many mid-cycle slowdowns in long expansions, there’s a better chance there won’t be a recession than there will be one when earnings fall.
To be clear, the recent cycles have been long as the 1990s and 2010s expansions have been the 2 longest since the 1800s. Since there isn’t much data in this calculation, the longer cycles might be a coincidence rather than a trend.
S&P 500 Stocks - Globalization has meant earnings growth is less correlated with the domestic economy.
That might be why the recent earnings recessions haven’t coincided with economic recessions. From 1948 to 1984, only one earnings recession didn’t occur during an economic recession.
It’s very important to note that this earnings recession hasn’t started yet as it’s not 100% certain earnings will fall in Q1 and Q2.
The Earnings Scout shows estimates are positive for both quarters; FactSet shows estimates are positive in Q2 and only negative 1.7% in Q1. If estimates call for only a 1.7% decline in Q1, earnings beats should push growth positive.
This earnings recession is unique because it is being catalyzed by the tax cut in 2018. If revenue grows in 2019, it’s fair to say this is a phony earnings recession. Growing revenues won’t coincide with an economic recession.
Furthermore, either this stock rally is completely out of touch with reality or investors are correct to expect a turnaround in the collapse of earnings estimates.
S&P 500 Stocks - Conclusion
Stocks are up way too much in the past few weeks. The higher stocks go, the more likely there is a major leg lower. That’s why I stated intermediate term bulls should root for a sideways correction. We haven’t gotten that.
Maybe the bulls who are buying stocks this high know earnings estimates will stop falling so quickly. If not, stocks won’t be higher than they are now by the end of the year. My viewpoint on the economy has changed in the past couple months as I would buy a pullback. Meaning, I’m confident this slowdown won’t become a recession.