Q3 GDP Growth - Solid October Consumer Confidence
The University of Michigan consumer confidence reading came in at 98.6. It missed the prior reading and the consensus which were both 99.
That’s not a big miss considering the volatility in the stock market lately. The final reading is down 1.8 points from the end of Septembet. But that was one of the best reports ever.
Specifically, the current conditions index fell 2 points to 113.1. Expectations index fell 1.2 points to 89.3.
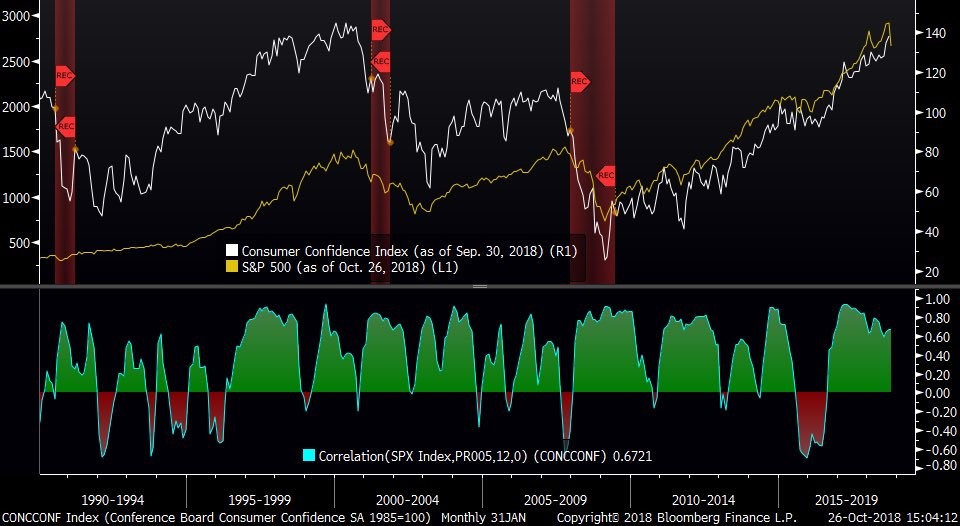
As you can see from the chart below, consumer confidence and the stock market are usually positively correlated.
The correction earlier in the year caused a very slight down-tick in consumer confidence. But that wasn’t enough to affect the economy. Consumer spending growth was strong in Q2.
It's interesting to see when the current stock market decline starts to affect the economy. A correction can be a self-fulfilling catalyst for weakness in the economy.
However, some would say there must have been something wrong with the economy for stocks to fall. Either way, volatility hasn’t affected sentiment yet. That's a positive if you think stocks will stabilize or spike higher from here.
1 year inflation estimates increased 0.2% to 2.9%. 5 year inflation estimates fell 0.1% to 2.4%.
It’s safe to say this consumer confidence report doesn’t signal inflation is too high.
Q3 GDP Growth - 3.5% Q3 GDP Growth
The hotly anticipated Q3 GDP report showed real growth was 3.5%. That beat estimates for 3.3%. The price index was up 1.7% which missed estimates for 2%.
Real consumer spending growth was 4% which beat last quarter’s growth rate of 3.8% and expectations for 3.3%. After this report came out, stocks struggled.
You can point to individual parts of this report to explain why stocks fell. But there are always some weak parts in GDP reports. Stocks are falling because of worries about future growth.
This report didn’t quell investors’ concerns. I still think it’s worth digging into this report to help color future expectations.
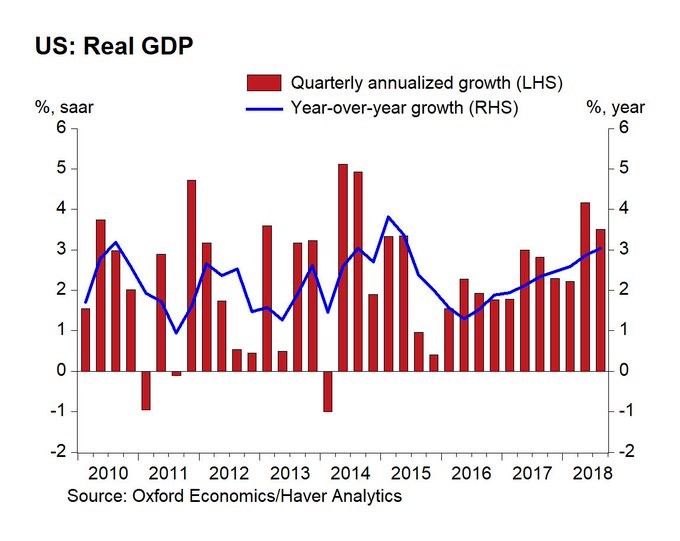
As you can see from the chart below, this was the best 2 quarter stretch of growth. That is, since Q2 and Q3 2014 where growth was 5.1% and 4.9%.
As is always the case, the Q3 2018 results will be changed throughout Q4 because of revisions.
Regardless of revisions, this the 18th straight quarter of positive GDP growth. The last negative report was Q1 2014 which was down 1%.
Q3 GDP Growth - Consumer Spending Growth Shines
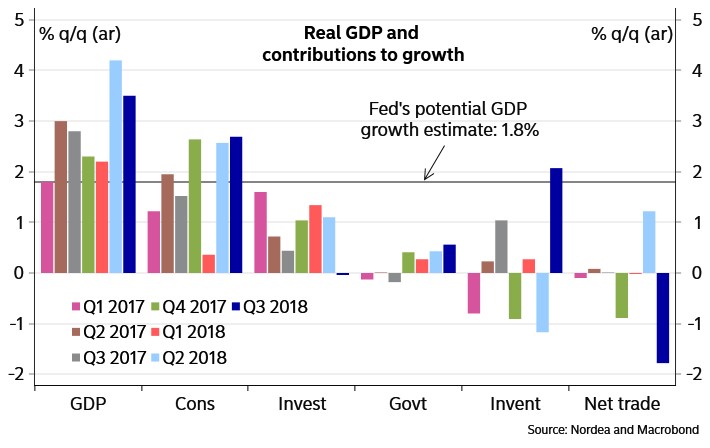
As you can see from the chart below, the best part of this report was consumer spending.
Specifically, it added 2.69% to growth. It's the most since Q4 2014 where consumer expenditures added 3.1% to growth. Growth was broken down fairly evenly between services and goods. Goods added 1.2% and services added 1.49% to GDP growth.
This was the strongest growth in consumption of goods since Q4 2017. That's when it added 1.42% to growth.
Also, this was the strongest growth in services expenditures since Q4 2014. At that time, it added 1.91%. These results are in tandem with the strong consumer sentiment reports.
Q3 GDP Growth - Inventories Help & Trade Hurts Q3 GDP Growth
The second biggest component of growth was from inventories. As mentioned in previous articles, I expected inventory growth to drive GDP.
It’s a one-time factor which makes this report look better than it is. Conversely, I also said net trade was going to be a big negative factor. This isn’t sustainable either.
You can see these abnormal results. These are reversals from Q2, in the navy blue bars in the chart above.
Specifically, the change in private inventories added 2.07% to GDP growth.
Q3 GDP Growth - Biggest Positive Surge Since Q1 2015
Q1 2015 had a 2.16% increase in GDP because of inventories.
The 1.17% drag in inventory investment in Q2 was the biggest drag since 1.28% in Q1 2014. Tariffs are causing firms to purchase goods ahead of time and then delay purchases. T
here will be more movement if the tariffs are eliminated as buyers will delay purchases until the tariffs are over. If the tariffs aren’t eliminated, eventually firms will pay the taxes. Or they will change from having international to domestic suppliers.
Stocks fell on Monday partially because there were new fears. Such as additional tariffs if the latest trade negations with China aren’t fruitful.
Trade hurt GDP as it caused a 1.78% drag on growth. This is the worst drag on growth going back to at least Q3 2013. The earliest data I have is from Q3 2013.
This quarter follows Q2 2018 which was helped 1.22% by trade. Which was the biggest positive to growth since Q4 2013. Then it was helped by 1.23%.
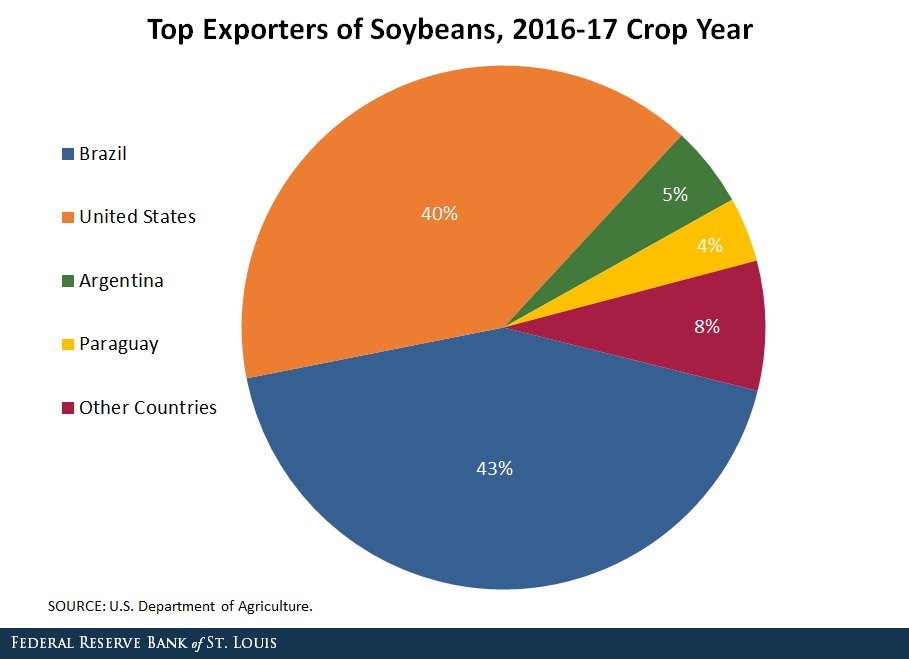
Q3 GDP Growth - Big Soybean Effect on the Inventory and Trade Data
The pie chart below which shows the top exporters of soybeans. It will be interesting to see how long China holds down its buying of American soybeans. It’s the harvest season in America while Brazil doesn’t produce much at this time of year.
Imports were up 9.1% which is in tune with strong consumption growth.
Exports fell 3.5%, which is their first decline in 2.5 years. Exports hurt growth by 0.45% which is the most since Q1 2015. That's when they hurt growth by 0.56%.
Imports hurt growth by 1.34%. That's the most since Q4 2017 when they hurt growth by 1.68%.
You can say that the tariffs are a one-off event. And that means we should ignore the trade and inventory data. However, I can counteract anyone’s thesis which ignores one without the other.
For instance, if you just ignore trade, growth looks amazing. And if you just ignore inventories, growth looks terrible.
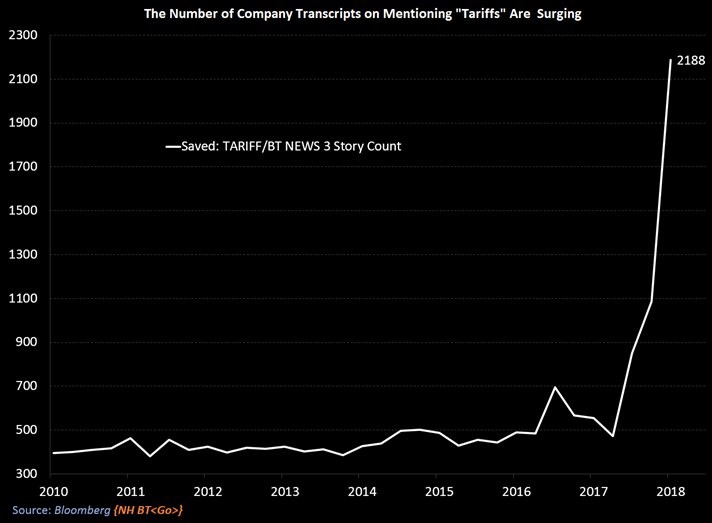
Unfortunately, it looks like tariffs will be around for at least a few more months.
As you can see from the chart below, firms have been mentioning tariffs a lot more in their latest earnings reports.
Part of the GDP report I didn’t review in this article is the weakness in business investment growth.