Jobless Claims - Hurricane Florence Boosts Jobless Claims
As I predicted, the jobless claims report was the first one to show weakness related to hurricane Florence.
Jobless claims were 214,000 which was a 12,000 increase from the previous week. The 4 week moving average only increased 250 to 206,250. It was 1,000 higher than the consensus estimate.
Almost the entire reason for the increase was hurricane related. Claims in North Carolina increased 8,000 to 10,209. Claims in South Carolina were up 1,900 to 3,362.
This means the hurricane won’t have as big of an economic impact as hurricane Harvey had last year.
It won’t be a saving grace for auto sales. Lightweight auto sales in August 2018 were 16.596 million, while sales were 16.452 million in August 2017.
Sales won’t spike to 18.089 million like they did in September 2017. The negative impact on GDP growth from the hurricane probably won’t be enough to push it below 3%. If it does fall below 3%, it will be because of economic growth deceleration not the hurricane.
Jobless Claims - Q2 GDP Revised
The final Q2 GDP growth reading was upwardly revised to 4.3% from 4.2%, making a great quarter look slightly better. The price index and real consumer spending growth stayed at 3% and 3.8%.
Non-residential fixed investment growth was revised higher from 8.5% to 8.7%. This is an amazing growth rate. Residential investment growth was revised 0.3% lower to -1.4%.
Government spending growth increased 0.2% to 2.5%. Inventories, which already showed a sharp drag on Q2 GDP growth, were revised to show a slightly greater drag.
Inventories should be replenished in Q3 which is why I expect it to show above 3% growth even if the economy decelerated. Net exports weren’t revised much.
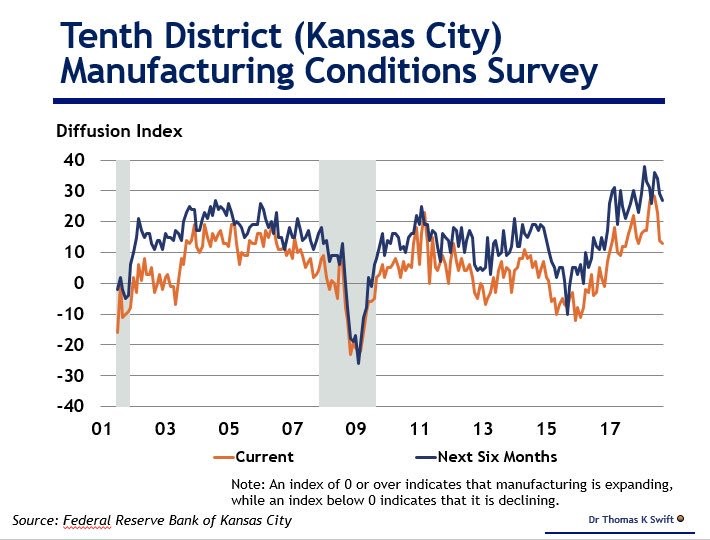
Jobless Claims - Kansas City Manufacturing Index Weakens Slightly
The Kansas City Fed manufacturing survey saw its composite index fall from 14 to 13.
As you can see from the chart below, it’s not as strong as it was earlier in the year. However, it’s still positive which means conditions are good.
The new orders index increased 6 points to 15. The number of employees index followed the overall national trend of some weakness in the manufacturing sector’s labor market. It fell from 14 to 1.
Inflation was almost unchanged as prices received fell 3 points to 24 and prices paid increased 1 point to 45.
Production was flat at 10. Keep in mind, all those results are on a month over month basis.
On a year over year basis, the composite index increased to 41 from 37. The production index increased 10 points to 44 and the new orders index increased 2 points to 46.
As you can tell, this was a decent report. The slight weakness is all in the month over month data.
Jobless Claims - Number of Employees Index - Up 3 points to 36
Capex index increased 4 points to 47. Inflation looks like it’s running extremely hot as the prices received index increased from 50 to 56 and the prices paid index increased from 67 to 79.
The tariffs are having a big effect on inflation in manufacturing. It will be interesting to see how the latest round of tariffs affects the overall inflation data in October.
The 6 month expectations index composite fell 2 points to 27. The production index fell 6 points to 38. New orders index fell 1 point to 35.
You can see in the chart above that the expectations index is usually higher than the month over month index. The divergence is currently high. It’s tough to say if that’s a good or bad signal.
Jobless Claims - Tariffs Hurting Firms More Than Tax Cuts Helped
Finally, let’s review the quotes from companies surveyed in the report.
“We intended to use any tax savings to improve our facility, equipment, process flow and employee pay/benefits. Unfortunately, unforeseen tariffs are consuming more dollars than realized by the tax savings. Once again, manufacturing takes it on the chin while the gap between government and manufacturing job growth has grown.”
This is a great comment because it compares the benefit from the tax cuts with the cost of the tariffs. It’s not a surprise that the firms hit the hardest by the tariffs are feeling a net negative impact.
Tariffs are going to seriously dig into the benefits from the tax cuts if the planned tariffs with China go through. Potentially all the imports from China could be taxed at 25%.
Jobless Claims - Trade In Goods Report Shows Increased Trade Deficit
The August trade deficit increased from $72.1 billion to $75.8 billion. This was worse than the consensus for $70.8 billion. Exports fell 1.6% and imports were up 0.7%.
Strong imports are a good sign for the consumer. Weak exports and strong imports will hinder GDP growth.
Q3 GDP will be hindered by trade as exports fell 1.7%. Imports were up 0.9% in July.
Overall, the average trade deficit in Q3 has been $74 billion which is much higher than the $67.6 billion deficit in Q2. These reports are more important than usual. They tell us the impact of the tariffs.
Plus, increased trade deficits could inspire President Trump to raise tariff rates and implement new ones on countries America doesn’t have a trade deal with.
Exports of agricultural products fell 9.5% in August to $11.9 billion. They fell 6.3% in July.
Q2 GDP growth was helped by a spike in soybean exports. We will see the reverse this quarter as American farmers face the wrath of the Chinese tariffs.
Industrial supply exports fell 5.9% to $43.8 billion and vehicle exports fell 2.8% to $12.7 billion. Consumer goods exports were up 10.3% to $17.6 billion. Capital goods exports were up 0.3% to $46.5 billion.
Imports for vehicles were up 3.2 % to $31.7 billion. Consumer goods imports were up 1.3% to $53.3 billion. Capital goods imports fell 0.9% to $57.6 billion. Imports of agriculture products fell 1.2% to $12.3 billion.