Core PCE Inflation - Personal Income Meets Estimates
Core PCE Inflation - The July Personal Income and Outlays report was released on Thursday. This is the most important report I follow because it tells us about income growth, inflation, and consumer spending.
The Fed follows core PCE inflation the closest which means if it accelerates, the Fed will need to raise rates quickly. The odds of that happening are slim to none. However, even with a slight increase in inflation, real wages have taken a hit.
Real wages have been strong on average this cycle, but not recently.
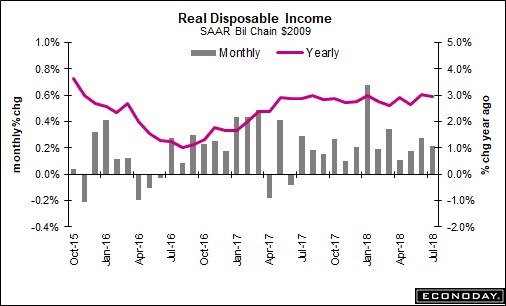
Month over month real disposable personal income was up 0.3% which met estimates and was down 0.1% from June.
On a year over year basis, growth fell about 7.5 basis points to 2.9%. As you can see from the chart below, growth has been around this level for over one year. It has been stagnant and positive unlike real wage growth.
Core PCE Inflation - Strong Consumer Spending Growth
Real consumer spending growth in Q2 was lowered from 4% to 3.8%, but that’s still an amazing number.
This July report gives us our first taste of how strong Q3 consumption growth is going to be. If it maintains that high growth rate, 2018 GDP growth will be the fastest of this expansion.
Such an acceleration in growth must make investors claiming there will be a recession in late 2019 concerned about their forecast.
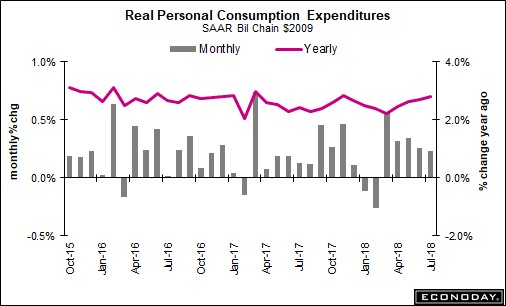
Real consumer spending growth was 0.4% month over month which met estimates and was the same as last month. On a year over year basis, it was up from 2.7% growth to 2.8% growth.
This is a continuation of the positive spending growth trend we have witnessed in the past few years. This goes along with the extremely positive results from the Conference Board survey which is a month ahead of this report.
Core PCE Inflation - Inflation Meets Estimates & Hits Fed Target
As I mentioned, the core PCE tells us the most about where Fed policy is headed in the near future.
Most of the stats met estimates. Headline PCE was up 0.1% month over month which missed estimates for 0.2% and was the same as June. Headline PCE inflation was up 2.3% year over year which met estimates and was 0.1% higher than last month.
Core PCE was up 0.2% month over month which met estimates and was 0.1% higher than June.
Finally, core PCE was up 2% year over year which met estimates.
It was 0.1% higher than June.
We’ve seen other months reach 2% inflation this year, but this was the highest as it hit 1.98%. That’s the highest year over year core PCE since April 2012. April 2012 was the last time inflation hit the Fed’s goal.
The Fed has said it wouldn’t hike rates quicker after inflation gets above its target because it has been below the target for most of this cycle. The latest Fed fund futures market shows there is a 70.3% chance of at least 2 rate hikes by the end of the year.
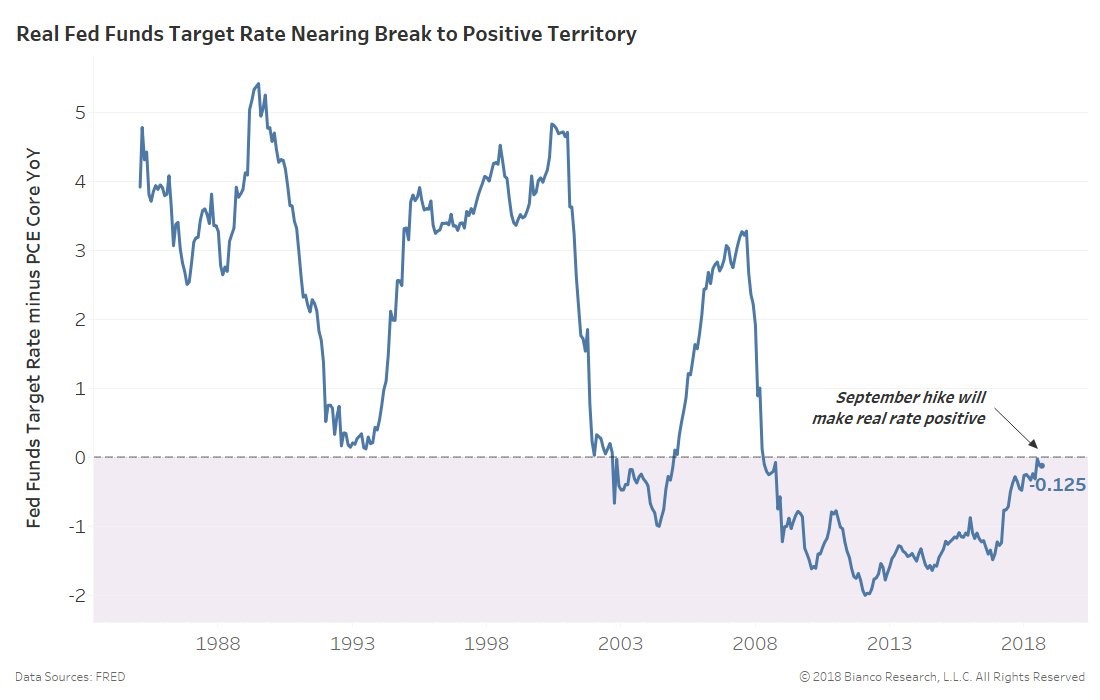
As you can see from the chart below, the real Fed funds rate is about to switch from negative to positive after the September rate hike.
This is a weird stat because it makes it look like the Fed is still relatively dovish. It makes people like me who think the Fed only can raise rates 3 more times this cycle look foolish.
It also makes the Fed itself look foolish for considering changing its language from being accommodative to either neutral or contractionary.
The real Fed funds rate peaked at above 3% last cycle. I will still follow my prediction, however, because the yield curve won’t allow the Fed to raise rates even close to that much.
The curve could invert after one or two more hikes. Time is also a factor with these hikes because the yield curve is like a sand hourglass which shows a recession is getting closer almost every day.
I love to look at year over comparisons because the data is often misleading.
Core PCE Inflation - Inflation is definitely higher than other points of this cycle, but the 2 year stack isn’t impressive.
Even though year over year inflation went up from 1.92% in June to 1.98% in July, the 2 year stack was lower. June 2017 core PCE was up 1.62% and July 2017 core PCE was up 1.5%.
The easiest comparison will be August as August 2017 had core PCE growth of only 1.41%.
August should be the first time in over 6 years where inflation hits the Fed’s target. In the following months, it should stay below 2%. It will probably decelerate sharply in March 2019.
The Fed is obviously following inflation, but it isn’t worried or panicked, because it’s highly unlikely that core PCE stays above 2% for long. The Fed has a Goldilocks economy as inflation is stable and growth is strong and consistent.
Core PCE Inflation - Details Of The Report
Proprietor income and personal interest income both slowed which hurt overall personal income growth.
The savings rate was down 0.1% to 6.7%. Savings rate could fall 1% and no one would be concerned.
Most people are still shocked by the revision which put the savings rate a few percentage points higher than we thought it was for a few years.
Durable goods spending held back consumer spending as there was weakness in auto sales. Service spending was up 0.4% which was down from 0.6% in June.
Core PCE Inflation - Conclusion
According to the July PCE report, inflation is low, consumer spending is strong, and real income growth is strong.
This is obviously old data. It confirms what we already knew. It confirms the stock market’s great performance in the past few weeks.
To me, it looks like the Fed shouldn’t raise rates much because inflation is under control.
However, I can’t criticize monetary policy at this juncture because the economy is doing well 9 years into the expansion.
There has been a big help from the tax cuts. The Fed is far enough away from the zero bound that it’s no longer an issue.