Q2 GDP Growth - Revised Higher
Q2 GDP Growth - Even though Q2 is long gone, we need to review the Q2 GDP revision because the data is now much more accurate. If you only look at the advanced reports, you’ll be missing out on what actually happened.
I expected GDP growth to be revised lower from the initial report of 4.1% because of weakness in consumer spending. We got the consumer spending weakness as growth was 3.8% instead of 4%.
However, the overall number was still revised higher from 4.1% to 4.2%. Overall growth beat estimates by 0.2% and consumer spending growth missed estimates by 0.1%. The GDP price index was 3% which was the same as the initial report and estimates.
The updated report was hurt by a deeper contraction in residential investment. Also, it was helped by upward revisions to non-residential fixed investment, government purchases, inventories, and net exports.
Consumer spending on durables and non-durables was revised lower, but the revised numbers were still strong. Growth in durables spending was 8.6% and growth in non-durables was 3.7%.
Services spending growth was unchanged at 3.1%. Residential investment was revised lower from -1.1% to -1.6%. Non-residential fixed investment growth was pushed up 1.2% to 8.5%. The equipment component was up 4.4% and the intellectual property component was up 11%.
Inventory subtraction was a big reason growth didn’t hit 5%. It led to the possibility that inventory investment in Q3 would push growth much higher.
Inventories were revised to subtract a little less from Q2 GDP growth as they are now at $26.9 billion. Exports subtracted $6.2 billion less from GDP as they were revised to $843.7 billion.
Q2 GDP Growth - Corporate Profit Growth Accelerates
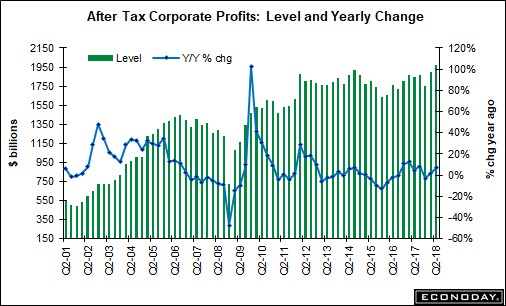
Corporate profit growth was interesting because growth was only 2.7% in Q1 even though S&P 500 profits exploded for gains of over 20%.
As you can see from the chart below, growth accelerated in Q2 as it was 6.7%. Profits hit a new record high. Pre-tax profits without inventory valuation and capital consumption adjustments were only up 0.2% which speaks to how much an impact the tax cuts had.
With inventory valuation and capital consumption adjustments, growth was 7.7% on a pre-tax basis. After taxes growth was 16.1%. Taxes on corporate income were down 33.4%.
One of the benefits of the tax cuts were supposed to be that growth would make up for the lower rate. If the rate is lowered and earnings increase, then taxes are supposed to go up.
The problem is pesky math makes this theory fail as earnings growth isn’t high enough to stabilizes the taxes collected. This is only one quarter of tax collections, but the budget is off to a rough start.
That being said, we haven’t seen any ramifications from the budget deficits.
The 10 year bond yield has been stable and the dollar has increased. Even though much is made of how bad deficits are, the American economy hasn’t been affected by them.
The borrowing cost on its debt has consistently gone down. America’s debt rating was downgraded, but that was because of government shutdown and debt ceiling fiasco. There wasn’t a real chance America was going to stop paying its debt.
Q2 GDP Growth - Confidence Versus Reality
As I mentioned, the consumer confidence reported by the Conference Board was off the charts good. It doesn’t equate with the negative real wage growth we have recently seen. It equates more with the stock market’s rise and the increase in disposable income catalyzed by the tax cuts.
The decline in the University of Michigan survey was catalyzed by the bottom third income group.
As you can see from the chart below, the Conference Board consumer confidence among those making between $15,000 and $24,999 is soaring to near the peak in the late 1990s.
It makes sense that this group wasn’t optimistic in the last cycle because the housing bubble didn’t help these people since they don’t own homes.
Even though they didn’t experience all the gains during the expansion, they received all of the pain during the recession. To be clear, the poor are always hurt the most by recessions.
This is an apples to apples comparison which shows the recession was the worst for this group in decades.
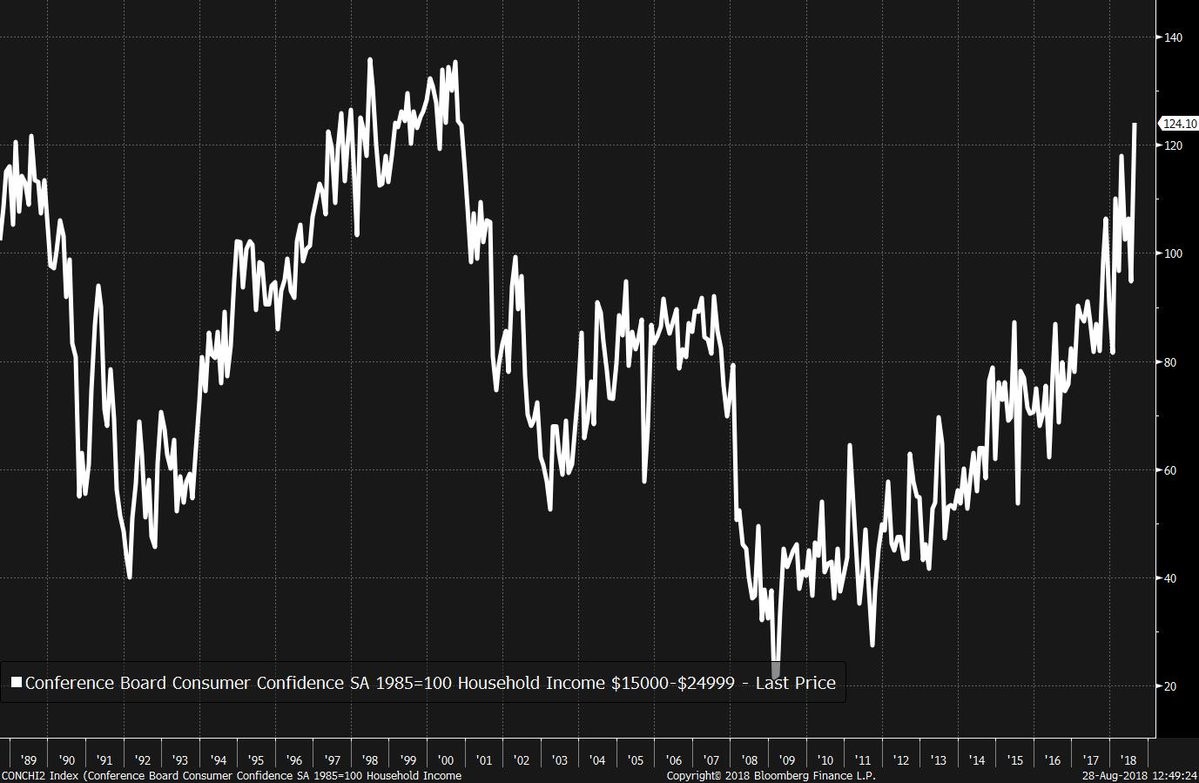
I find it remarkable that this income group is so optimistic because the prevailing narrative for years has been that the lower income group has been unable to get ahead and pay bills.
Income inequality is a major political issue which isn’t consistent with this survey.
Q2 GDP Growth - Real Wage Growth
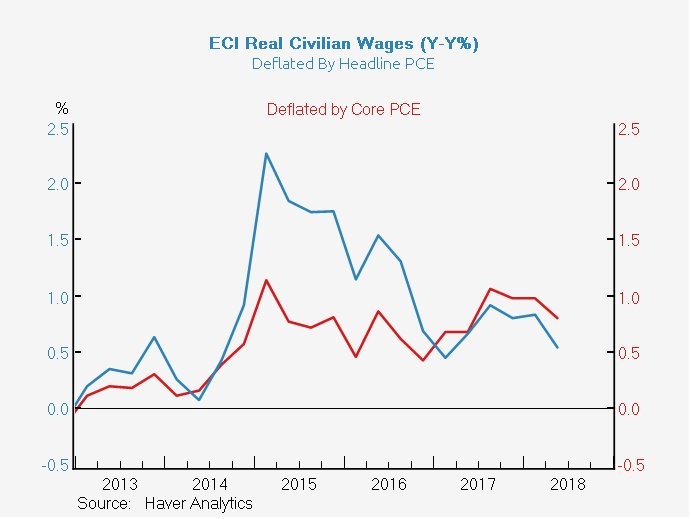
Optimism has trickled down to the lower income group, but wage growth is still being eaten up by inflation.
The chart below shows the ECI year over year growth when deflated by core PCE and headline PCE. To be clear, I focus on headline CPI which is higher than these two.
However, it’s worth reviewing other data points. As you can see, both are weakening quickly as inflation is growing faster than wages. The core and headline adjusted wages are about the same now.
There was a big divergence in 2015 and 2016 because the oil price crash allowed headline wage growth to be strong. It’s fair to look at the core results to see the underlying trend, while noticing that headline deflated wages tell us what the consumer is taking home.
My point in showing this chart is that confidence doesn’t match the numbers. The poor are never going to be amazingly well off, but positive real wage growth would certainly help.
Q2 GDP Growth - Conclusion
I don’t want to tell the poor whether they should be confident, but real wages haven’t grown recently, so the confidence could be a mistake.
To be fair, wages aren’t the only thing that affects confidence. Because the labor market is almost full, job stability is up.
It’s also worth noting the consumer thinks inflation will be 4.8%. If it hit that rate, wage growth would be way into the negatives. The consumer’s understanding of inflation is way different from CPI and PCE.