GDP Estimates
GDP Estimates - Since we discussed the durable goods report which goes right into GDP, it makes sense to review the latest estimates for Q3. The average of 12 estimates in the GDP rapid recap show growth will be 3.4%. The St. Louis Fed’s Q3 Nowcast fell from 3.69% to 3.64%.
The Atlanta Fed Q3 GDP Nowcast had an odd increase as it went up from 4.3% to 4.6%. It is way above the other forecasts.
New home sales and costs report caused the estimate for real investment growth to increase from -4.5% to -1.1%.
In the last update, I mentioned it would be almost impossible for real residential investment to fall that much while GDP grew above 4%. Now we see what growth would be if real residential investment growth isn’t a disaster.
Improvement in this estimate is probably correct, but the overall estimate is too high as we will see.
The durable goods report that I just discussed caused the real non-residential equipment investment growth estimate to increase from 6.4% to 7.5%. This estimate is likely way too high.
It will come down when the ISM manufacturing PMI comes in at 55 on September 4th. As I mentioned, inventory investment increased, which should help GDP this quarter. Inventories ran low at the end of last quarter.
The estimate for the contribution of inventory investment to GDP growth went from 1.92% to 2.03%.
The headline disappointment in durable goods orders should hurt GDP growth. However, the Atlanta Fed’s model used it to upgrade its estimate. The NY Fed downgraded its estimate based on this report, which I think is correct.
The NY Fed’s Nowcast fell sharply from 2.39% to 1.96%. The durable goods report is responsible for all but 4 basis points of that decline. Just because I agree with this change doesn’t mean I think growth will be below 2%. It all depends on how strong consumer spending growth is.
GDP Estimates and the S&P 500 - New Record Is Reached
The S&P 500 finally hit a new record closing high like I said it would. The S&P 500 was up 0.62% on Friday. This has been a great year as the S&P 500 is already up 7.52%. The Russell 2000 is up 12.38% year to date even though about 25% of the firms in the index don’t make money and 60% have junk rated debt.
The VIX was down 3.38% to 11.99. The CNN Fear and Greed index is at 68 out of 100 which signals greed. Now that the market has made new highs, I don’t think there is much more upside.
You can view this high as breaking the glass ceiling because it took so long to do so even though it has been close for a while. However, I don’t think the weakening fundamentals justify much more upside.
GDP Estimates - Netflix Rallies
Netflix stock reversed its weak trend as it rose 5.8%. The stock was up because SunTrust said it has about 21% upside since the price target was lowered from $415 to $410. The firm said Netflix’s original shows are doing well in India.
Personally, I wouldn’t change my opinion on the company based on one weak quarter when there have been so many strong years of growth.
There were discussions about replacing Facebook or Netflix from FAANG, but that is a mistake as both are growing their earnings quickly. Netflix helped the consumer discretionary sector increase 0.59%.
The best sectors were materials and technology which increased 1.21% and 1.1% respectively. Consumer staples fell 0.17%.
GDP Estimates - Weak New Orders, Strong Core Capital Goods Orders
Headline July durable goods orders were weak which means GDP estimates should come down. However, core orders were strong which signals the economy is doing well outside of the volatile stats like aircraft orders.
Keep in mind the weakness in the Philly Fed and Kansas City Fed reports were in August.
There was strength in the soft data in July, so the core capital goods orders growth doesn’t differ from those reports.
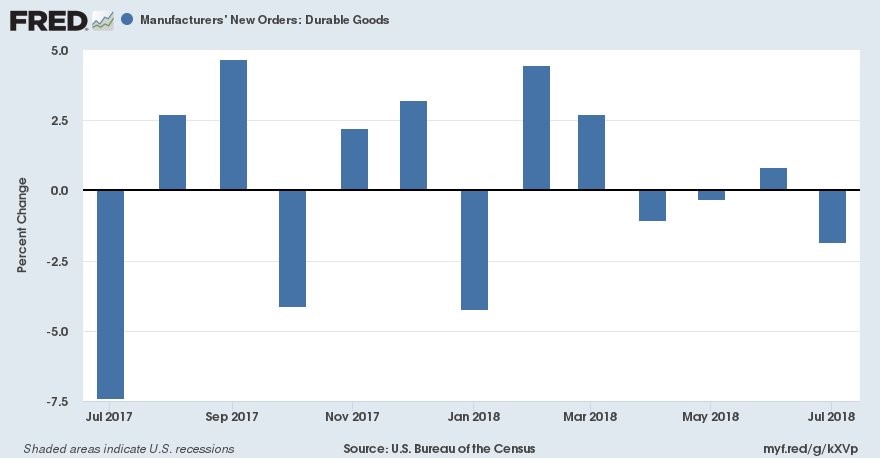
As you can see from the chart below, new orders were down 1.7% month over month which was the weakest report since January. This missed estimates for a decline of 0.8%. June’s growth was revised from 1% 0.7%.
Usually when prior reports are revised down it’s good news for the latest report, but that didn’t help July reach a good number. Excluding transportation, durable goods orders were up 0.2% which missed estimates for 0.5% growth.
June’s growth was revised from 0.4% to 0.1%. The star of the report was the core capital goods growth which was 1.4% which beat estimates for 0.5% growth and July’s growth of 0.6%.
Computers and electronics as well as machinery helped core orders beat estimates.
GDP Estimates - The headline report doesn’t matter in terms of understanding the direction of the economy.
Aircraft orders are volatile and uncorrelated with the economy. Commercial aircraft orders were down 35.4%.
This weakness along with the weakness in defense aircrafts caused the transportation reading to come in at -5.3%. The vehicle sentiment reading was the worst in 4 years in August. However, the new orders were strong in the July report as they increased 3.5%.
The core capital goods order shipments feed into business investment in GDP. Shipments in core capital goods were up 0.9% in June and July. The increase in June’s report from 0.7% will help the Q2 GDP report.
There was a 1.3% increase in durable inventories which makes sense because inventories were running low heading into the quarter. Commercial aircraft and primary metals inventories were up.
The tariffs catalyzed the increase in primary metals inventories. There was a 0.2% decline in shipments of durables.
GDP Estimates - Conclusion
There weren’t many important reports this week. The durable goods report was the most important. I think it’s bad for the Q3 GDP report, but it shows economic growth is strong.
The hard data reports are always delayed, but they give us an official picture of how the economy is doing.
It will be interesting to see the August hard data reports because the August soft data has been weak.