Stocks Fall After Getting Overbought
The stock market fell on Friday as the S&P 500 was down 0.66%, the Russell 2000 was down 1.89%, and the Nasdaq was down 1.46%. Twitter and Intel were down 20.5% and 8.6% respectively which hurt the Nasdaq. The tech sector was the worst performer as it was down 1.99%; telecom was the best as it was up 1.93%. It’s easy to claim a few big tech firms’ bad earnings reports are symbolic of a bad earnings season, but that’s way off. This has been a good earnings season. Stocks were down Friday because they were overbought.
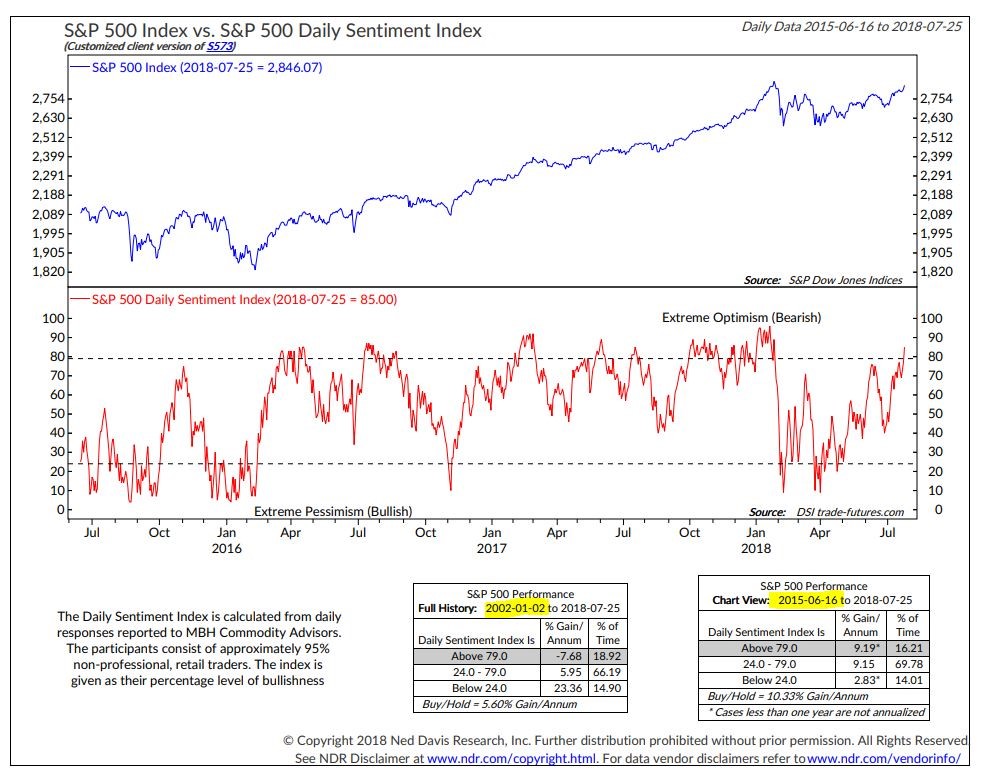
As of Thursday’s close, the Fear and Greed index was 72 out of 100 which a very bearish signal. After Friday’s sell off, the index fell to 67. As you can see from the chart below, the S&P 500 daily sentiment index hit 85 out of 100 on Wednesday. When the index has been above 79 since 2002, the annualized losses are 7.68%. Euphoria is back in the market just as it gets close to reaching its record high. There may need to be additional declines to moderate the sentiment. After that, I think the market can hit a new record.
Earnings Season Has Been Good
As I mentioned, don’t get down on earnings season because Facebook, Intel, and Twitter crashed. The overall market still is in good shape. Facebook is the only member of the FAANG acronym which in bad shape. Tesla and Apple report earnings next week. With 263 earnings reports in the books, 84% beat estimates with 27.2% growth; 75% beat sales estimates with 10.7% growth. Those numbers are as of Friday evening.
The charts below show the numbers as of Wednesday. As you can see, every sector has a positive EPS surprise rate, with energy showing the highest growth total at 325% and utilities having the highest EPS surprise rate at 8.98%. Only 2 industrial firms out of 43 have missed estimates. The industrials continue to show us that tariffs haven’t hurt their businesses yet. The latest worry about tariffs is Trump is threatening to put a 25% tax on auto imports. The good news is that Trump’s recent negotiations with Europe could make this threat unlikely to be implemented.
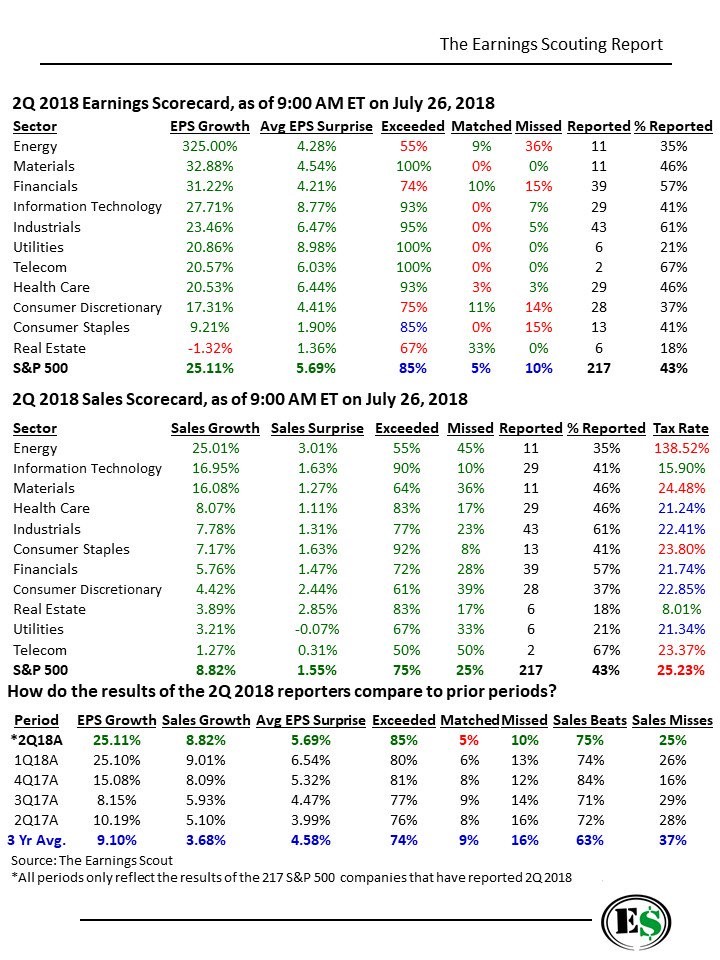
The sales growth rates are impressive as the average beat rate is 1.55%. Since the average sales growth was 8.82% with 217 firms reporting and the average sales growth was 10.7% with 263 firms reporting, the firms reporting later in the week must have had strong sales growth. The bottom table shows the average EPS growth remained higher than last quarter as it was 25.11%. With the average after 263 firms reporting being 27.2%, the EPS reports late in the week also must have been very strong. The 85% beat rate is 5% higher than last quarter and 11% higher than the 3 year average. There is a secular trend which is pushing the beat rate higher as the analysts are lowering their estimates purposely to allow earnings reports to look good. However, this won’t work out in the next earnings recession as investors will see past the beats and sell stocks.
Treasuries Rally
As I mentioned earlier in the week, the Japanese 10 year bond yield increased and then sold off modestly after the central bank promised to buy bonds at a 0.11% yield. In the past 2 days, the yield has increased further as it is now at 10.4 basis points. This is the highest yield since January 2016. When the yield spiked on Monday, the U.S. yields also rallied, but that didn’t occur on Friday.
Treasuries and telecom stocks rallied while tech stocks fell in an old fashioned ‘risk off’ trade. The 10 year bond yield fell 2.22 basis points to 2.9542%. The 2 year yield only fell 1.21 basis points to 2.6694% which means the curve flattened. After a couple of sharp days of steepening, the difference between the 2 yields is now 28.48 basis points which means we are back where we were last week. The relentless curve flattening is continuing. The bond market will probably have a strong reaction to the PCE report on Tuesday. The Fed will be staring a very flat curve right in the face during its August meeting on Wednesday. There is a 2.5% chance of a hike on Wednesday. There is now a 67.6% chance of at least 2 hikes by the end of the year.
Twitter’s ‘Bad’ Earnings
With Twitter’s 20.54% decline on Friday, it had it’s second to worst day in its history. The worst was in 2014 when it declined 24.2%. The culprit was weak monthly active user growth and weak adjusted EBITDA guidance. EPS was 17 cents which matched estimates. Revenues were $711 million which beat estimates for $696.2 million. As you can see from the chart below, revenue growth has increased to 24% as the company has turned its business around. Monthly active users were 335 million instead of 338.5 million. Guidance for adjusted EBITDA was $215 million to $235 million which was way below the street’s estimate for $268.1 million.

The number of accounts declined for 3 reasons. First, Twitter deleted 70 million accounts in May and June to combat abuse and make the social network safer. It’s great that the company is starting to care more about spam and abuse than meeting investors’ expectations on the total number of accounts. Second, the company decided to not move to paid SMS carrier relationships in a few emerging markets where users are on Twitter Lite. Third, GDPR impacted the business in Europe.
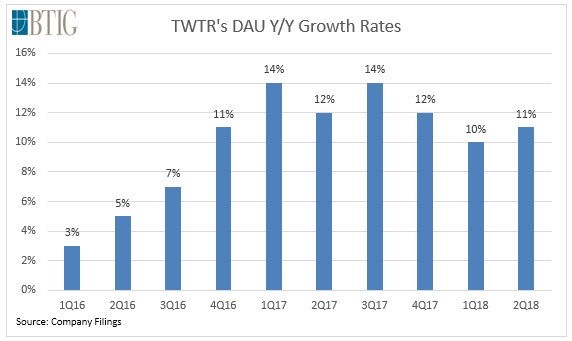
I think these are all temporary factors which will be gone in the next few quarters. The service is healthier than ever as the company is making sure to support real users who don’t post abusive tweets. I think the stock declined because it was up so much recently and has a high multiple. In the long term, it should be fine. As you can see from the chart below, the more important daily active user growth has been in the double digits for 7 straight quarters. Ad engagements were up 81% from last year, which was better than the firm’s estimate of 76%.