Solid Philly Fed Report But Weakening Outlook
I will continue discussing the economic reports from last week to catch up as earnings season has caused a bit of a delay in my economic analysis. The July Philly Fed manufacturing headline reading was strong as it came in at 25.7 which beat the consensus estimate for 22. It was above the high end of the range which was 24.5 and was above last month’s reading of 19.9. One of the hot topics on Wall Street is comparing the economic growth readings from February to today because there has been a sharp drop off in Europe. There hasn’t been much of a drop off in America as the soft manufacturing reports are very close to the February peak. Like I have been saying, this has been a 6 month plateau. That doesn’t mean there won’t be weakness by the end of the year. It simply means growth has sustained longer than I thought it would.
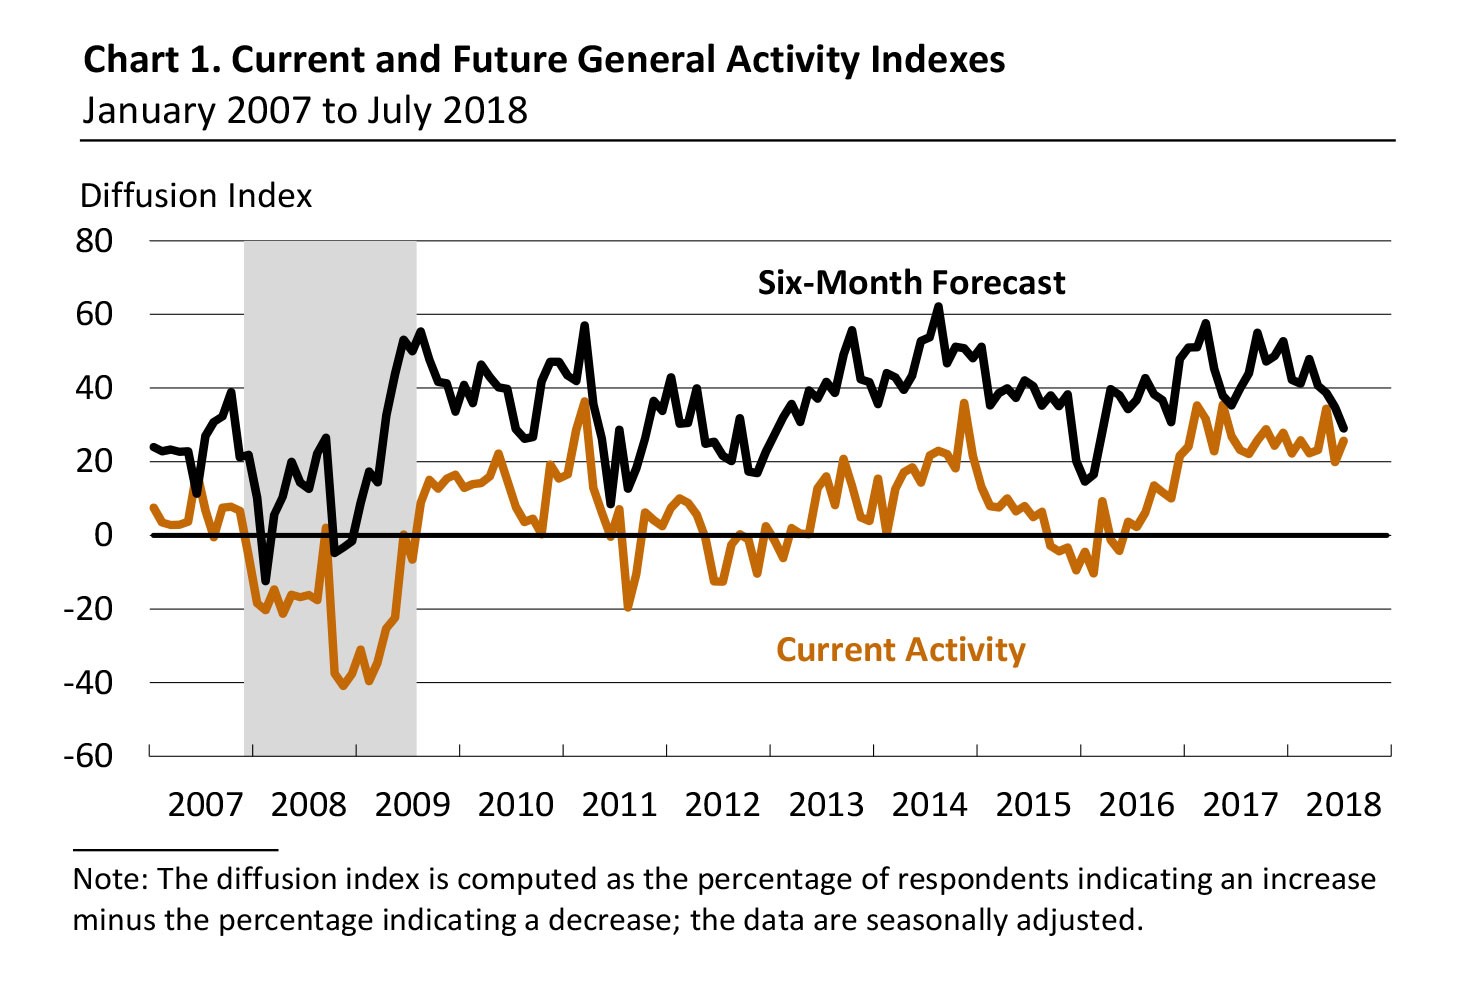
As you can see from the chart below, while the current index has been looking strong for about 1.5 years, the 6 month forecast is in a down trend. The diffusion index fell from 34.8 to 29.0. It’s notable that in the past 11 years the 6 month forecast has only fallen below the current index in mid-2007. That could be something to look out for if the 6 month forecast falls again next month. There was a very sharp increase in the new orders index as it went up from 17.9 to 31.4. Unlike the Empire Fed index, this one looks like the manufacturing sector is overheating as the unfilled orders index was up from -2.7 to 11 and the delivery times index was up from 9.6 to 11. The measurement of inflation continued to move up.
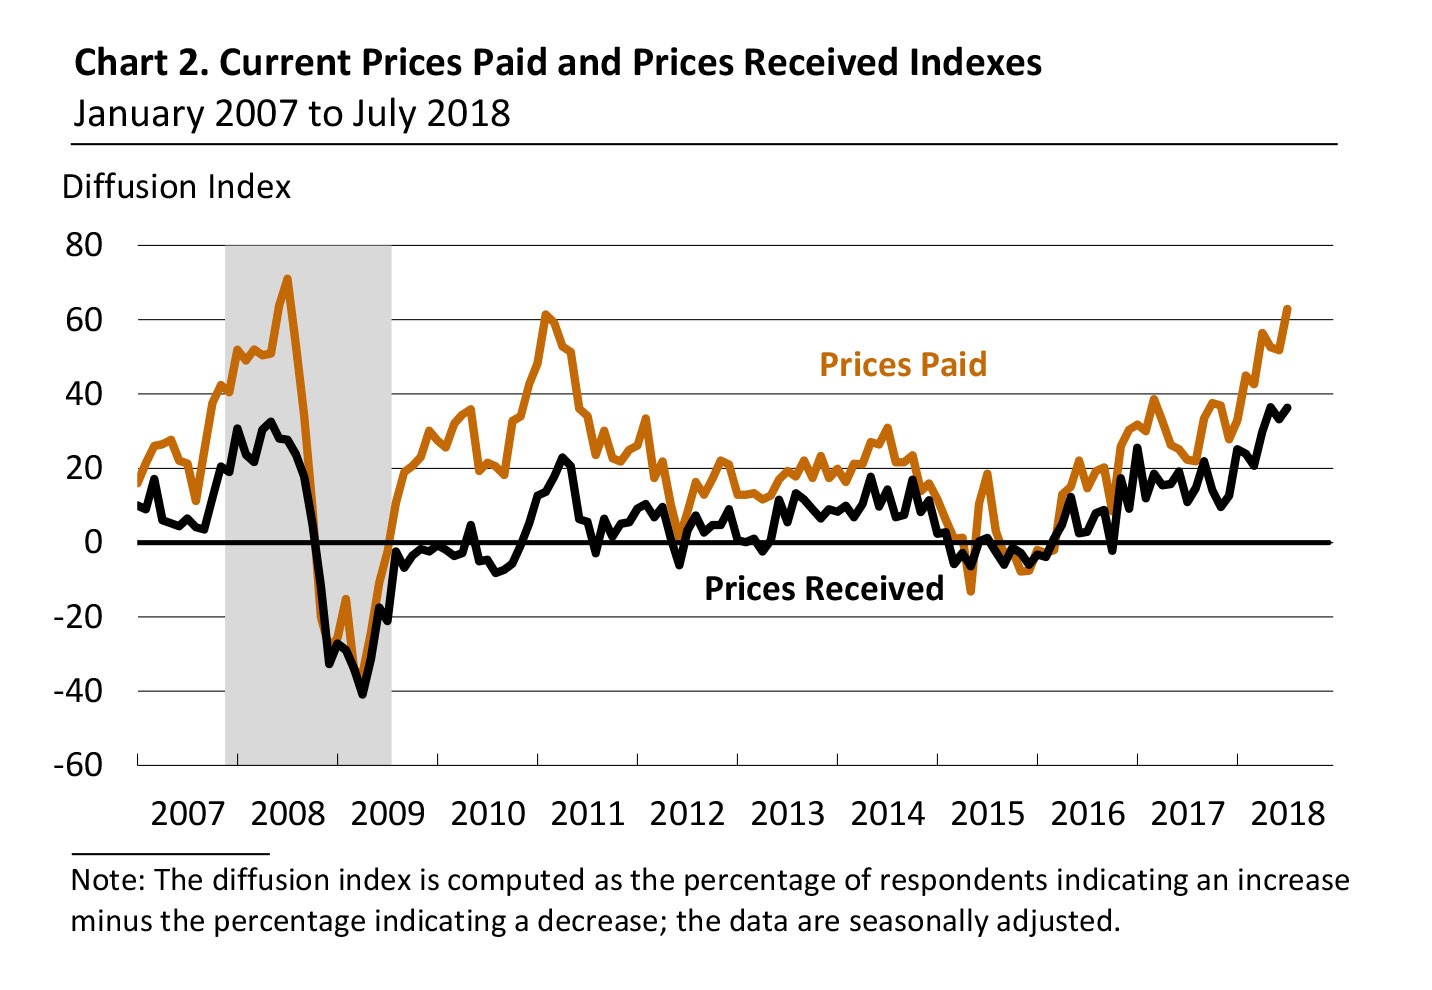
As you can see from the chart below, the prices paid and prices received indexes are charging much higher. The prices paid index increased from 51.8 to 62.9 and the prices received index increased from 33.2 to 36.3. Tariffs helped cause the sharpest rise in input costs since July 2008 and the highest reading in the prices paid index ever. It’s remarkable to see such low inflation in the overall economy compared to this index. However, the Philly Fed report is only a regional report on manufacturing which has a small sample size.
It gives you an idea of what the economy would look like if tariffs effected the overall economy. While tariffs might go up, it’s impossible for services to be hurt by tariffs as much as manufacturing because it has much less international business. The big input cost is workers not physical goods such as steel and aluminum.
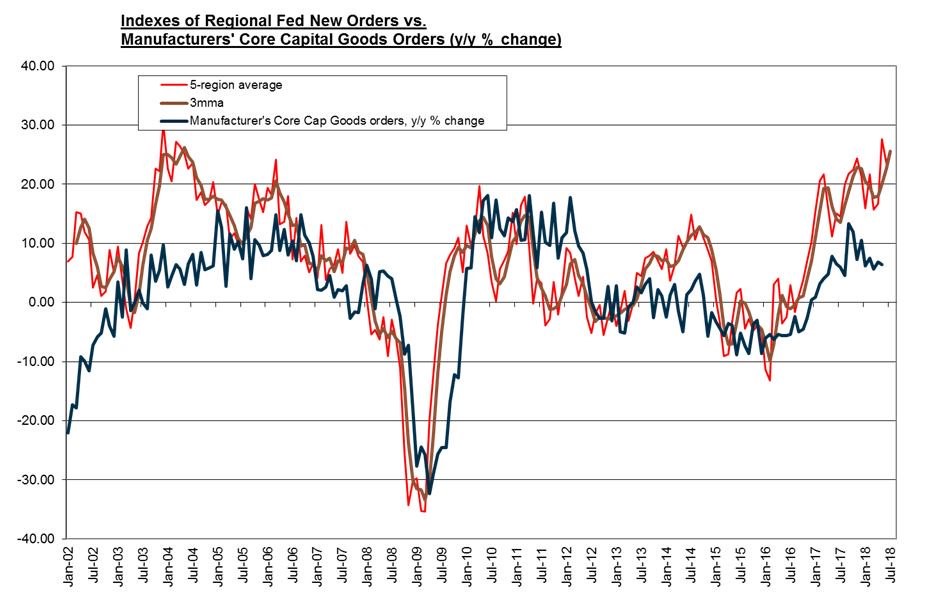
The 6 month expectation for new orders fell sharply, unlike the current index. This decline from 38.2 to 28.3 is partially responsible for the difference in the trend between the current and 6 month forecast. The chart below shows the 5 region average of new orders compared to manufactures’ core capital goods orders. As you can see, ever since the increase started in 2017, the regional Fed data has been stronger than the hard data. The core capital goods orders seem to have peaked, but also are at a solid plateau. Keep in mind that this isn’t the only hard data to review. The most recent industrial goods report was strong as well.
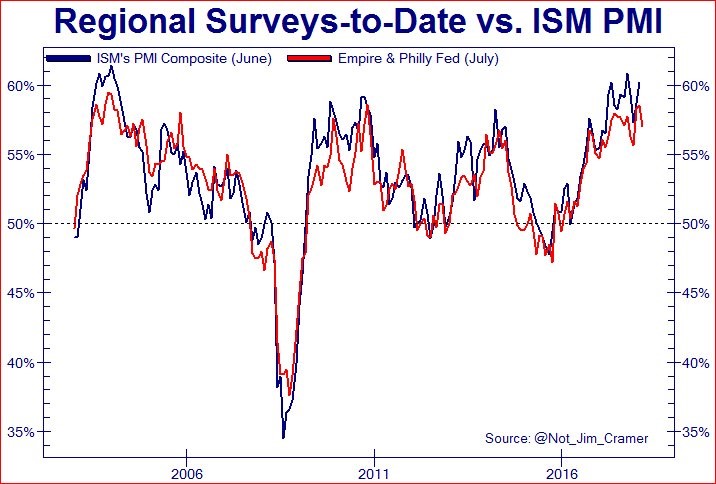
Finally, we have the Empire regional Fed survey and the Philly Fed report compared to the ISM PMI report. As you can see, since both are soft data reports, the correlation is higher than in the chart above. The two regional Fed readings are consistent with about a 57 ISM manufacturing PMI for July. The July ISM manufacturing report will be released on August 1st. The prior reading was 60.2 which means there might be a small slowdown in the headline reading next month.
Strong Leading Indicators
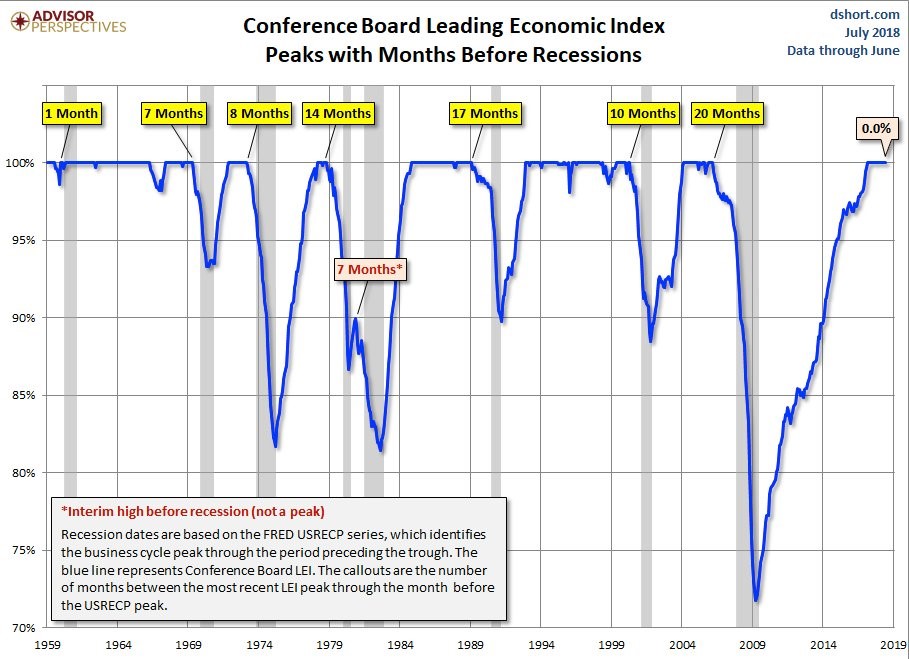
The leading indicators have an 83% correlation with next year’s GDP growth. Whenever the leading indicators have been positive since 1960, the GDP growth rate in the next year has been above 1.5%. I’m expecting GDP growth in 2019 to decelerate, but remain positive as the yield curve is still normal. As you can see from the chart below, since the early 1960s, the leading indicators have peaked at least 7 months before recessions. That means there probably won’t be a recession in the next 7 months since they are at a record. This brings us to early 2019 without a recession. Even though recessions happen quickly, there usually isn’t a moment where the economy goes from growing very fast to declining instantly.
Specifically, this report, which was released last Thursday, showed a 0.5% month over month change which beat estimates for 0.4% growth and was above the prior revised reading which showed no growth. The stock market is part of this reading. It has surely helped as July has had great returns and there have been zero days where the S&P 500 has moved more than 1%.
Very Strong Jobless Claims Report
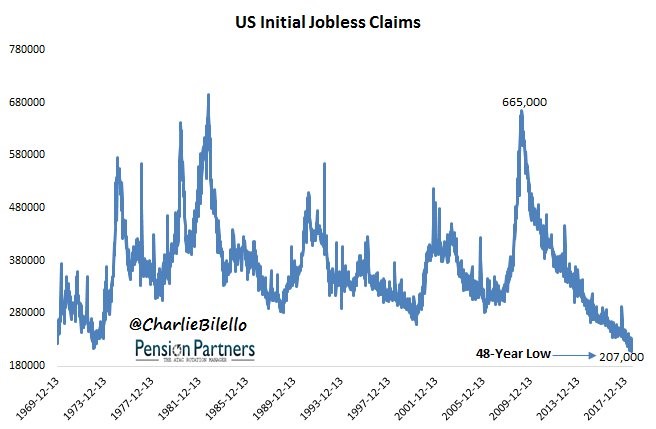
I was wrong to suggest the jobless claims report had reached its low for the cycle. As you can see from the chart below, last week’s report showed the jobless claims were 207,000 which is a new cycle low. This is the lowest number of claims since December 1969 when the labor force was much smaller. This is by far a record low in the ratio between claims and the labor force. The reading fell from 215,000 claims in the previous week.
This was the sample week for the monthly employment report which means it should show a great number. That being said, there’s not much improvement from June’s sample week reading as there were 218,000 claims last month. The 4 week moving average fell from 223,250 to 220,500. The reading can’t fall much more. I’m interested to see the labor force participation rate for June because if the rate falls, the unemployment rate will likely fall to a new cycle low. That would mean the two major establishment readings are showing the labor market is extremely tight.