Solid E-commerce Sales
The e-commerce sales for Q1 were released on Thursday. The quarter over quarter seasonally adjusted sales were up 3.9% which was higher than last quarter’s 3.2% growth. However, the year over year growth was down from 16.9% to 16.4%. Unsurprisingly, there was a big share gain since the retail sales at brick and mortar stores were weak in Q1. Online as a percentage of total sales was up from 9.1% to 9.5%. As a millennial, I’m surprised that number isn’t at least 20% as I shop online much more often than the older generations. There’s no question that this trend of online share gains will continue which means more store closings. Clearly, online sales aren’t a great barometer for the consumer yet because share gains mean growth even when retail sales as a whole are weak. I’m interested to see if online retail sales fall in the next recession because it will likely be over 10% by then. Either online sales structurally increase shopping or growth will mimic the overall sales results in the future (the more likely options).
Great Leading Indicators Report
The leading indicators report was solid as growth was 0.4% month over month which met estimates. Last month’s growth was revised up by one tenth to 0.4%. The increase in the factory work week and the normal yield curve were the biggest positives in the index while the stock market and building permits held the index back. Since I’m using this as an indicator for the stock market, if stocks are the only thing holding it back, that’s great news.
Economy & Stocks Act in Tandem
I don’t think of the stock market as a leading indicator like many do. The stock market acts concurrently with economic outcomes. The stock market peaked in October 2007 and the recession started 2 months later. It didn’t go down sharply until the financial crisis started blowing up. Housing had peaked in 2006, but investors thought the problem was contained and wouldn’t cause a recession. The 2001 recession was very mild. Stocks peaked in March 2000, but the decline was more related to the bubble popping in technology stocks than the economy crashing.
My thesis on the market being concurrent is why I have been bullish this year. It’s fair to worry about 2020, but historically stocks don’t decline 2 years before a recession. If stocks were stable in the next 2 years or fell, the actual decline in 2020 wouldn’t be bad. That’s another reason why I was buying in February. People often fear corrections after they have taken place. That’s just like how people called for a melt up in January 2018 even though the melt up had happened. The melt up had rising prices but didn’t have very high PE multiples like projected. Frankly, I don’t believe in making predictions not based on the fundamentals. You can’t just say stocks will go up to extreme valuations for no reason. There can be examples where stocks have acted against the fundamentals and even the technicals, but I wouldn’t predict the unpredictable.
To summarize, because I’m optimistic about the economy and earnings this year, I’m bullish. I expect gains to be weak next year and stocks to decline in 2020. Your risk tolerance will determine when you decide to get out of the market. If you need the money in less than 5 years, there’s no question you should have a lowered allocation to ‘risk on’ assets such as stocks and junk bonds.
Optimistic Expectations
There’s a weird quirk in the GDP Nowcast from the Atlanta Fed where it will take 9 days to come up with a new update. The latest result we are left with is 4.1% growth from May 16th. Also from May 16th we have the CNBC GDP tracker which averages a few estimates; it’s at 3.6%. The CNBC tracker proposes to be more accurate than the others. We’ll see after this quarter as this is the first time I’ll be following it. The St. Louis Fed Nowcast isn’t as optimistic as it has been in the past as it expects 3.65% GDP growth. That’s right in line with many other estimates.
I still think the NY Fed estimate is the most reliable early in the quarter because it doesn’t have big fluctuations like the Atlanta Fed report. The hundredth of a point the NY Fed indicator uses is actually relevant. With the speed at which the Atlanta Fed indicator changes estimates, the tens place is barely valuable. Obviously, the most valuable part of these models is the final estimate, but since we invest throughout the quarter, it’s nice to know how it’s going. Therefore, the concurrent stats are valuable. Accuracy is important.
The NY Fed estimate is currently at 3.2% which is up from last week’s report of 2.97%. This is the 2nd highest estimate for this quarter thus far. The industrial production and capacity to utilization reports added 0.18% and 0.14% respectively to the estimate. That’s what I expected would happen. The model will start forecasting Q3’s estimate in 2 weeks.
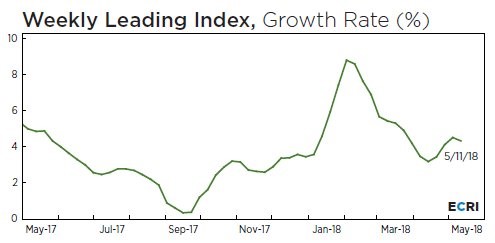
The chart below shows the weekly leading index report. It’s growth rate fell from 4.5% to 4.3%. That’s the first drop in a few weeks. I’m not concerned by this change as the indicator is still positive. It steered us in the correct direction 8 months ago when it forecasted a slowdown in Q1 and it steered in the right direction starting in late 2018 when it told us to expect a rebound in Q2. The first forecast translated into a stock market correction, but the second one hasn’t translated into a rally yet.
Conclusion
The change in the NY Fed index shows us that my summary of the positive results this week has been accurate. My prediction that the economic results would improve has been spot on. However, we’re still waiting for a big rally in stocks. The market had a great run last week ago, but this week was mostly flat as the S&P 500 was up just 14 points.