Slightly Negative Friday
The stock market was down slightly on Friday as the Nasdaq was down 0.38% and the S&P 500 was down 0.26%. The S&P 500 remains stable right after it broke out from its streak of lower highs. Personally, I’m bullish on American economic growth and earnings which means I expect a new all-time high, but I understand the hesitance to buy because Europe and Japan look weak and the dollar has been strong. This leads us to the Russell 2000 which was up just 0.08%. This flat performance didn’t stop the prognosticators from reviewing it closely because it hit a new all-time high.
Indexes Difference From Their Record
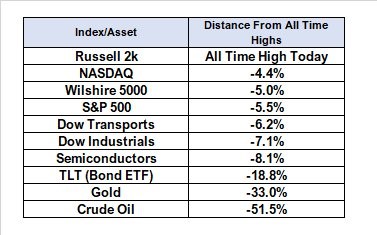
The chart below shows the major indexes’ difference from their all-time highs as of Thursday’s close. The Nasdaq is the closest of the major indexes (besides the Russell 2000) even though the semiconductors are down 8.1% from their high. The TLT has obviously been falling because the bond market has been selling off. Interestingly, the S&P 500 has outperformed the TLT 10 days in a row which hasn’t happened in the past 10 years. The main reason that stat is true is because the bond market is in a multi-decade bull market. That period includes the financial crisis where stocks crashed.
The Bears Are Attacking The Russell 2000
As I mentioned, the prognosticators have been reviewing the Russell 2000 closely because the S&P 500 hasn’t made a new high sinceJanuary and the Russell 2000 is hitting records. The obvious question which follows is which index is correct. I think they’re both acting reasonably, so this action doesn’t mean you need to short small caps or buy large caps. The dollar rallying means the domestically oriented small caps have a higher purchasing power to buy goods from abroad. The internationally focused large caps make money abroad and need to adjust the profits into the dollar terms which means the profits will be lowered as the dollar index increases. The latest close in the dollar index is $93.66; it is up 5.12% in the past 3 months.
This isn’t the only reason for this small cap outperformance. As I mentioned, the U.S. economic growth is accelerating. The small caps are seeing the same great economy as the small businesses said they were seeing in the NFIB survey. The bears are not excited by the records seen in the Russell 2000 as they are ready for the S&P 500 to fall into a bear market. They have two main criticisms of the Russell 2000. The first is that the small caps are highly indebted which is bad news in a rising rate environment. My counterpoint to their claim is that the highly leveraged small caps will only be in trouble relative to the highly capitalized large caps when the junk bond yields increase relative to investment grade bonds. The junk bond-investment grade spread is extremely low, so that’s far from occurring.
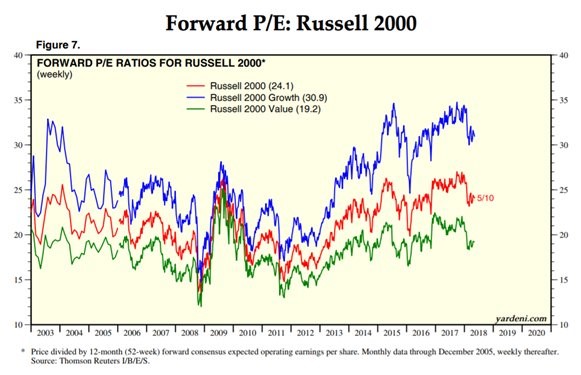
The second point is seen in the chart below. The chart shows the forward PE which is especially elevated for the growth names. An even bigger contention is the current PE which is 89.15 which is over triple the Nasdaq and S&P 500’s PE. The Nasdaq 100 PE is 24.65 and the S&P 500’s PE is 24.27. Even worse for the Russell 2000 is that the index doesn’t include the firms which don’t make a profit. This hasn’t mattered since I’ve been following the index, but it could be an issue in the next recession. One other point is the Russell 2000 doesn’t have great performance compared to the S&P 600. The S&P 600 is actually up 2.19 % from its record high in January, but it doesn’t get nearly as much publicity as the Russell 2000. My recommendation is if you are bullish on small caps, buy the S&P 600. The S&P 600’s PE is 50.44 and the 12 month forward PE is 17.78.
Inflation Estimates
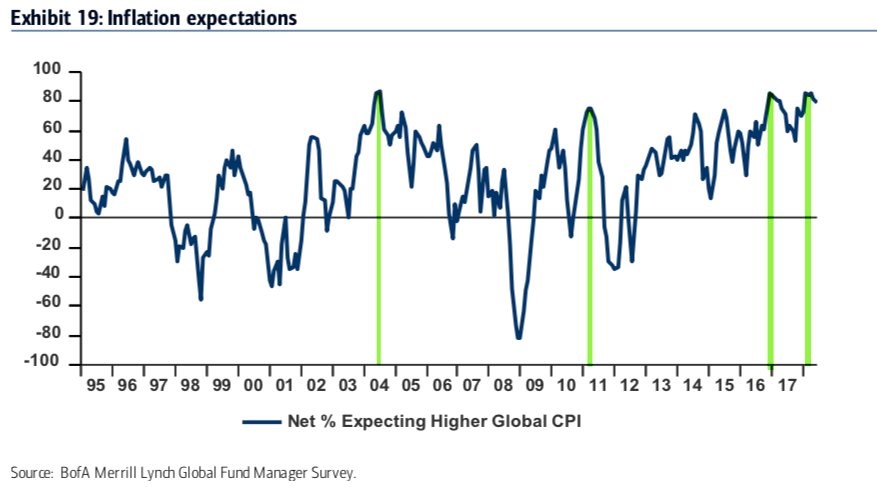
Fund managers’ inflation expectations are near the highest in 14 years. I find it interesting how this survey along with the regional Fed surveys imply inflation is extremely heated, but the core CPI is only 2.1%. Clearly, the inflation rate is much lower now than it was in the mid 1990s even though the current index seen below is higher. For example, in 1995, the index was slightly positive, but inflation was between 2.9% and 3.2%. The Philly Fed prices received index was the highest since May 1981. The core CPI was 9.5% in May 1981. I think inflation expectations have come down structurally, so historically low inflation triggers these indexes because no one expects core CPI to get to 3% again. The other possibility is these indexes are based off rate of change so going from 1.7% to 2.1% can push the surveys higher than going from 5% to 5.3%.
Fund Manager Positioning
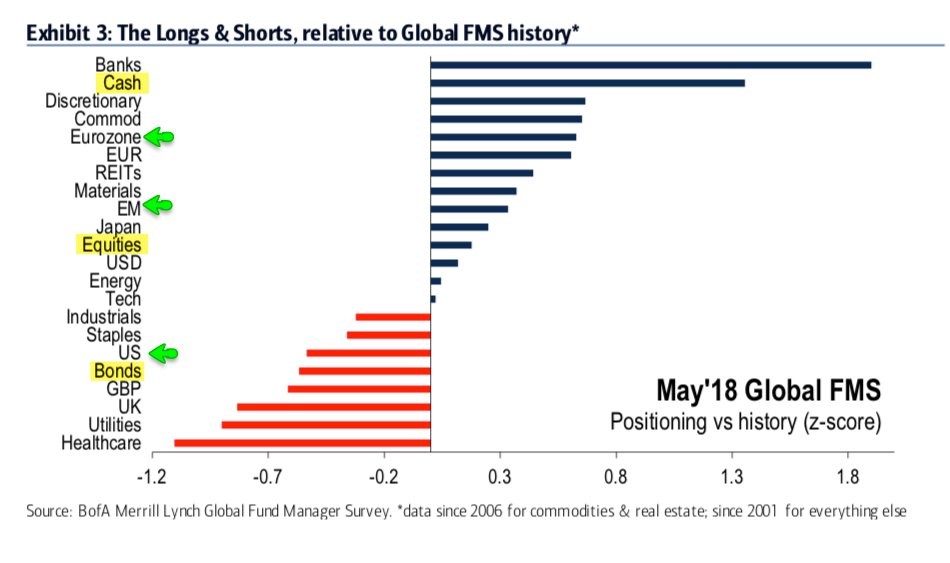
The chart below is interesting because the emerging markets are overweight, but they have done poorly recently. Since the start of April, the Vanguard Emerging Markets fund is down 4.32%. Fund managers think the selloff caused by the rally in the dollar is overdone. Managers are overweight cash and underweight U.S. stocks. I think this is a mistake as earnings and economic growth look good. The other unique strategy these fund managers have is they are only slightly bullish on energy despite the chart above showing inflation is expected to be high. Since April 1st, the XLE S&P energy index is up 15.87%.
Conclusion
To be clear, I expect inflation to increase modestly in the next few months. I’m just making the point that core CPI won’t get to 3% anytime soon. As long as inflation only increases slightly, the Fed will increase rates slowly. So far, this has been a slow hike cycle, but it can obviously switch to fast if the data changes. It’s good to see fund managers are underweight the U.S. stock market because it means they can switch to overweight in the next few weeks which will push the S&P 500 to new all-time highs aside the Russell 2000.