Industrial Production Was Strong
I’m looking for green shoots in the economy as I expect Q2 to be a rebound from Q1. American economic growth is headed in the opposite direction as Japan and Europe which have decelerated. Emerging markets are doing poorly because the dollar has strengthened. After we get some green shoots, I will be more bullish on stocks as all-time highs in the S&P 500 will be justified.
We got the first green shoot on Wednesday in the April industrial production report. Production was up 0.7% month over month which beat the consensus for 0.6% growth. Furthermore, the prior month’s results were revised up from 0.5% to 0.7%. You can see the year over year growth in the chart on the left. The comparisons are tougher this year than last year, but the growth has still been strong. Manufacturing growth was 0.5% month over month which beat the consensus for 0.3% and was stronger than the prior month’s flat growth. The chart on the right shows capacity to utilization is rebounding. The report was 78% which missed the consensus for 78.3% but was above the prior month’s report of 77.6%.
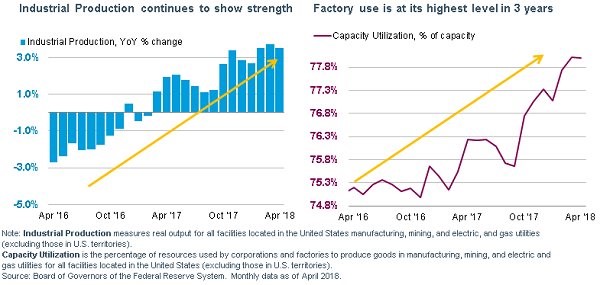
The chart doesn’t show that the rate is still below the peak for the cycle which was 79.6% in November 2014. If economic growth continues in the next few months, that number can be bested. It’s interesting to see some manufacturing strength because there appeared to be weakness creeping in especially in the regional Fed surveys. The mining output was up 1.1% month over month and the utility output was up 1.9%. The most noteworthy part of this report was the improvement in business equipment volumes which were up 1.2%. The production of consumer goods was up 0.9% which is a good sign that the consumer may be rebounding from the weak Q1.
Vehicle production fell 1.3%. I’m bearish on the auto sector as the latest NY Fed household debt report for Q1, which was released Thursday, shows that auto loan delinquencies increased from 4.1% to 4.3%. The peak in the prior cycle was only 5.3%. This means the 90+ day delinquency rate is closer to the peak of the prior cycle than the trough of this cycle which was 3.1%. Construction supplies were up 0.3% which shows the tariffs didn’t have any effect on production. Clearly, the metals tariffs are small potatoes compared to the potential for tariffs on China if these latest trade negotiations don’t go well. It’s needless to say that the GDP growth estimates will improve after this report. It’s a good signal that the hard data is backing up the optimistic estimates.
Great Philly Fed Report
Adding to the strong industrial production report from April was the very strong Philly Fed report for May. The diffusion index was 34.4 which was above the consensus for 21 and above the highest estimate which was 26. It beat last month’s 23.2. There was a 45 year high in new orders. Specifically, the new orders index was up 22 points to 40.6 which is the best number since March 1973. Here’s a stat which throws some cold water on this amazing report. The extremely optimistic March 1973 report was 8 months prior to the 1973-1975 recession. You can say this is a useless forward looking indicator or you can say very high numbers signal the economy is exceeding its capacity which means a recession is coming in the next year.
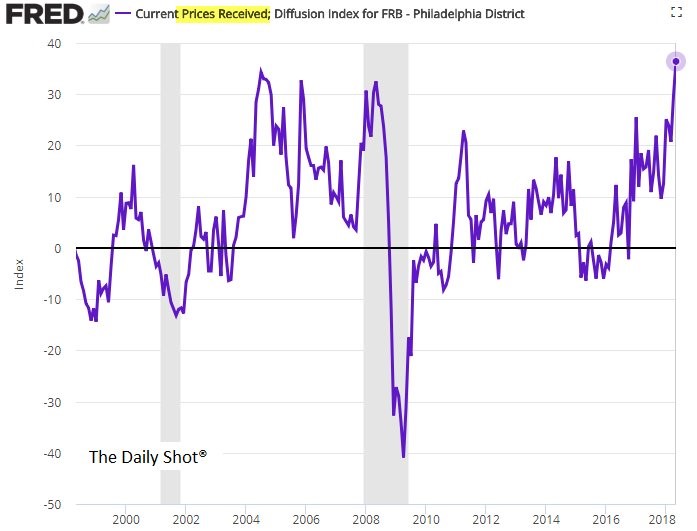
While I don’t think a recession is coming in the next year, this report definitely signals the economy is overheating. As you can see from the chart below, the prices received index increased 7 points to 36.4 which was the highest figure since May 1981. The prices paid index fell slightly from 56.4 to 52.6, but that’s still a very elevated level. The delivery time index was down from 20.7 to 18.5, but that is also at an elevated level. The unfilled orders index increased from 7.8 to 15.3 signaling there’s stress in the supply chain.
The 6 month outlook index fell from 40.7 to 38.7. I don’t think the 6 month outlook is a great leading indicator of this report especially since the previous month showed a 9 point decline which isn’t consistent with this report which ended up being amazing. Finally, the average work week index and the number of employees index were both up as the manufacturing labor market remains tight. The number of employees index was up from 27.1 to 30.2 and the average work week was up from 21.6 to 34.4.
Very Good Empire State Manufacturing Report
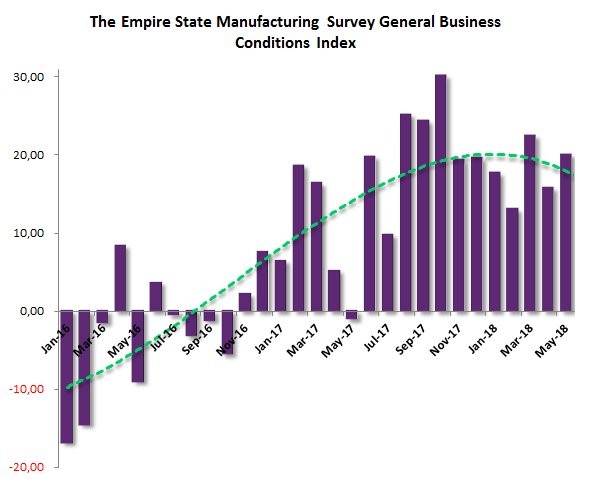
There is a clear trend in the data I’m presenting in this article. The manufacturing economy looks good after some weakness in the prior month or two. The Empire Fed Index was 20.1 which beat the consensus for 15.5 and the highest estimate in the range which was 19. As you can see in the chart below, last month the index was at 15.8; it was down on fears of tariffs. Just like the Philly Fed report, the new orders index was strong as it increased 7 points to 16. Unlike the Philly Fed report, the 6 month outlook was very optimistic as it went from 18.3 to 31.1. The outlook had fallen last month because of the tariffs.
Just like the Philly Fed report, the prices received and prices paid indexes were at multi-year highs. Prices received was up 2.3 points to 23 and prices paid was up 6.6 points to 54. As you can see, the economy seems to be heating up based on these regional surveys. The all-important PCE report will be released on May 31st, but that’s for April, so these reports aren’t pertinent. These are early warning signs that the core PCE might go above 2% in the May report. It’s much too early to tell because the May CPI report isn’t out yet. Frankly, I’m excited by the headline numbers from these regional reports and I’m not too concerned with the prospect of inflation running out of control.